Symas Corp., September 2014
Test Overview
Using the server we generate a database with 100 million records. The records have
16 byte keys and 100 byte values so the resulting database should be about 11GB
in size. After the data is loaded a "readwhilewriting" test is run
multiple times in succession. The number of reader threads is set to
1, 2, 4, 8, 16, 32, and 64 threads for each successive run. (There is always
only a single writer.) All of the threads operate on randomly selected records
in the database. The writer performs updates to existing records; no records are
added or deleted so the DB size should not change much during the test. The
results are detailed in the following sections.
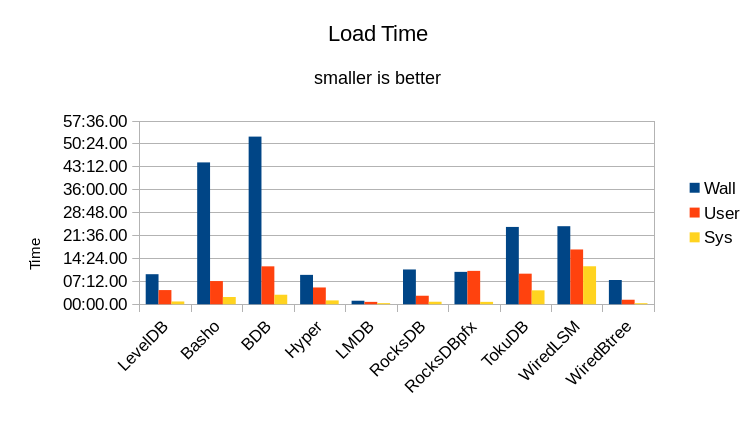
Loading the DB
Here are the stats collected from initially loading the DB.
| Engine | Load Time | CPU | DB Size | Process Size | Total Size | Context Switches | |||
|---|---|---|---|---|---|---|---|---|---|
| Wall | User | Sys | % | KB | KB | KB | Vol | Invol | |
| LevelDB | 09:24.39 | 04:26.36 | 00:52.31 | 56 | 11702148 | 540488 | 12242636 | 204233 | 625 |
| Basho | 44:28.12 | 07:15.42 | 02:15.19 | 21 | 13128020 | 127916 | 13255936 | 85254 | 12304 |
| BDB | 52:32.77 | 11:51.71 | 02:59.45 | 28 | 38590332 | 21499600 | 60089932 | 1196561 | 3162 |
| Hyper | 09:12.10 | 05:15.21 | 01:11.65 | 70 | 11644136 | 725100 | 12369236 | 219303 | 2023 |
| LMDB | 01:05.73 | 00:45.22 | 00:20.43 | 99 | 12580708 | 12583076 | 12583076 | 9 | 192 |
| RocksDB | 10:53.73 | 02:39.76 | 00:46.74 | 31 | 11745460 | 624916 | 12370376 | 398909 | 325 |
| RocksDBpfx | 10:09.24 | 10:27.97 | 00:44.74 | 110 | 12207504 | 13456836 | 25664340 | 195089 | 1134 |
| TokuDB | 24:12.76 | 09:35.02 | 04:20.47 | 57 | 14991692 | 18798900 | 33790592 | 1091241 | 1951 |
| WiredLSM | 24:27.22 | 17:08.86 | 11:53.50 | 118 | 12607732 | 1156020 | 13763752 | 18163720 | 4903 |
| WiredBtree | 07:35.84 | 01:24.96 | 00:18.78 | 22 | 11909312 | 314008 | 12223320 | 7268 | 151 |
We're running RocksDB in both a basic configuration and again in the tuned configuration used in the original RocksDB benchmark report. The tuned run is denoted as "RocksDBpfx" in all of these results.
The "Wall" time is the total wall-clock time taken to run the loading process. Obviously shorter times are faster/better. The actual CPU time used is shown for both User mode and System mode. User mode represents time spent in actual application code; time spent in System mode shows operating system overhead where the OS must do something on behalf of the application, but not actual application work. In a pure RAM workload where no I/O occurs, ideally the computer should be spending 100% of its time in User mode, processing the actual work of the application.
The "CPU" column is the ratio of adding the User and System time together, then dividing by the Wall time, expressed as a percentage. This shows how much work of the DB load occurred in background threads. Ideally this value should be 100, all foreground and no background work. If the value is greater than 100 then a significant portion of work was done in the background. If the value is less than 100 then a significant portion of time was spent waiting for I/O. When a DB engine relies heavily on background processing to achieve its throughput, it will bog down more noticeably when the system gets busy. I.e., if the system is already busy doing work on behalf of users, there will not be any idle system resources available for background processing. LMDB is effectively ideal.
The "Context Switches" columns show the number of Voluntary and Involuntary
context switches that occurred during the load. Voluntary context switches are those which
occur when a program calls a function that can block - system calls,
mutexes and other synchronization primitives, etc. Involuntary context
switches occur e.g. when a CPU must handle an interrupt, or when the running
thread's time slice has been fully consumed. LMDB performs no blocking calls
and uses no background threads, so there are practically no context switches
during its run. All of the other DBs have multiple orders of magnitude more
context switches, yielding much lower overall efficiency. None of the other
DBs can perform the initial load anywhere near as quickly as LMDB.
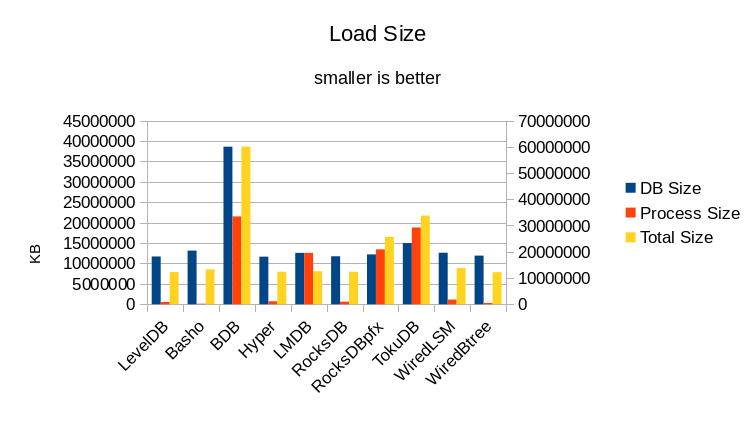
The DB Size column shows the size of the DB files on disk after the load
completes. The Process Size column shows the maximum size of the benchmark process
during the load. The Total Size column shows the total amount of RAM consumed
during the load; it is usually the sum of the DB and Process sizes since the
DB occupies space in the filesystem cache. For LMDB it is simply the Process
size, since the memory used by the filesystem cache is included in the LMDB
process.
Throughput
The results for running the actual readwhilewriting test with varying numbers
of readers are shown here. Results
are further broken down by DB engine in the following sections.
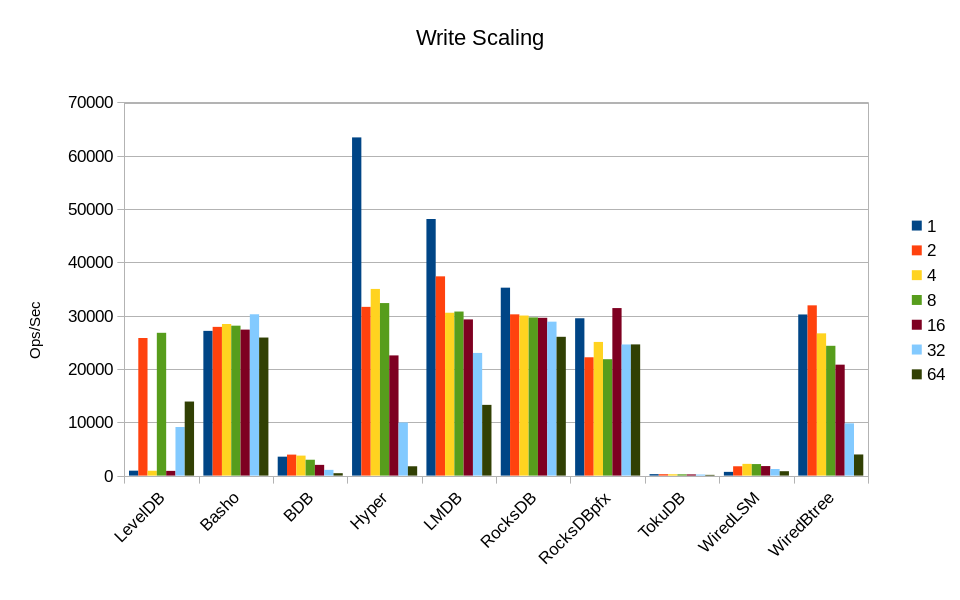
RocksDB in its minimally tuned configuration appears to sustain write load the best across various threading loads. HyperLevelDB performs extremely well when there's just a single reader, but as soon as another read thread is added its performance drops sharply.
LMDB's write performance is pretty good up to 16 readers. The decline at 32 and 64 was a bit surprising and bears further investigation.
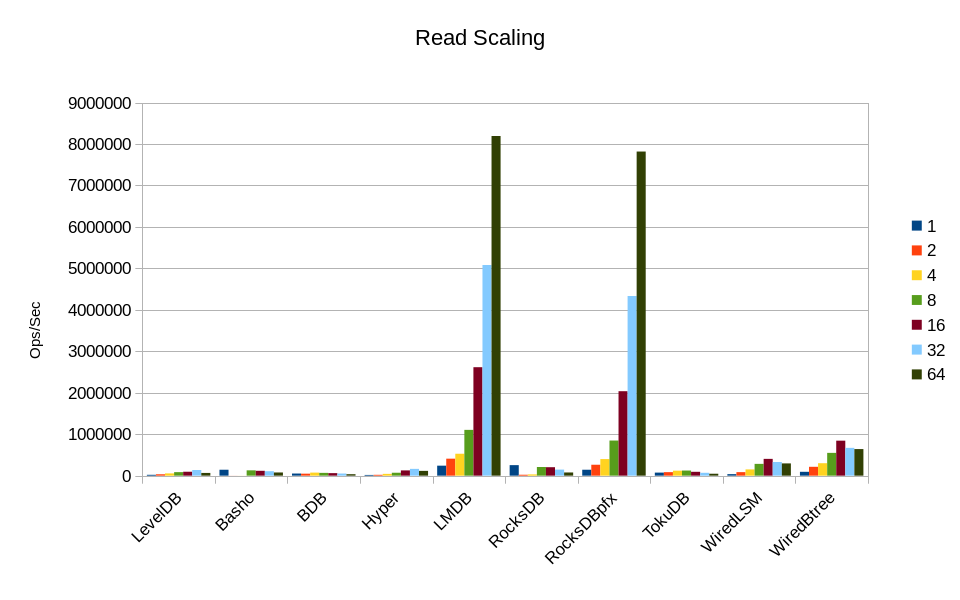
LMDB is clearly the leader here, with read performance scaling linearly with the number of cores. RocksDB in its highly tuned configuration is almost as fast. Too bad that tuning RocksDB is so complex that even its own developers don't understand it. LMDB outperforms all of the rest, with no special tuning.
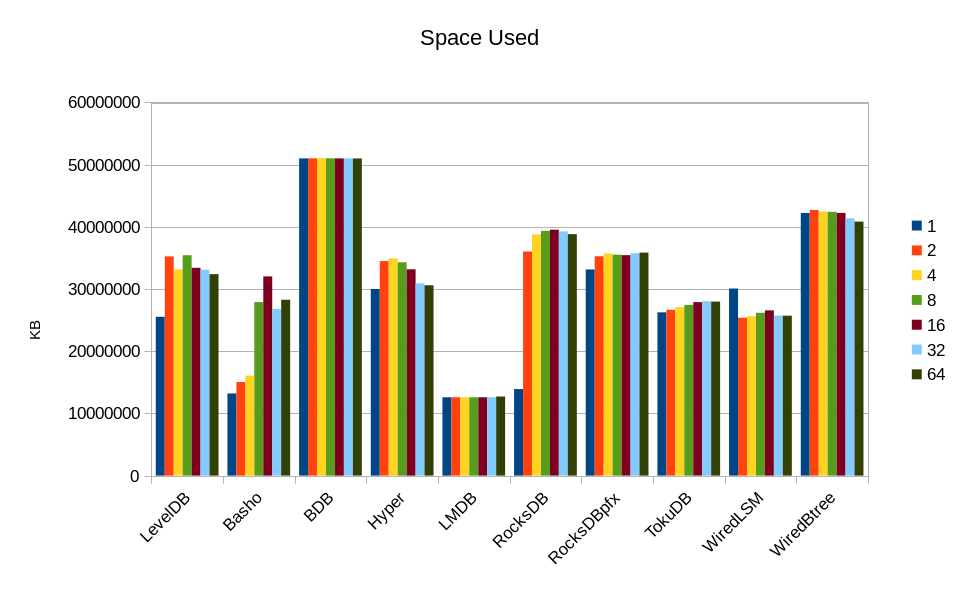
Software optimization is always about optimizing both time and space. Often we
have a good idea of what speeds we require for a given task, but provisioning
the size can be much trickier. For most of these DB engines, the amount of
memory consumed varies wildly with the changing workload. For BDB and LMDB
the size is essentially constant. Also, as noted in our original design paper,
we targeted LMDB at consuming about one-third as much memory as BDB. In practice
we usually come in at only one-fourth as much, as shown here.
For expedience, the test duration is set to 10 minutes for each run. The DB-specific results follow.
| Threads | Run Time | CPU % | DB Size | Process Size | Total Size | Context Switches | Write Rate | Read Rate | |||
|---|---|---|---|---|---|---|---|---|---|---|---|
| Wall | User | Sys | Vol | Invol | |||||||
| 1 | 10:03.84 | 00:11:22.91 | 00:00:28.26 | 117 | 16248852 | 9284764 | 25533616 | 620540 | 1249 | 918 | 20088 |
| 2 | 10:24.56 | 00:21:06.89 | 00:03:29.16 | 236 | 16911164 | 18340088 | 35251252 | 897864 | 2785 | 25810 | 32517 |
| 4 | 10:38.81 | 00:34:47.48 | 00:05:20.86 | 377 | 16237996 | 16935340 | 33173336 | 3815398 | 1292 | 909 | 53910 |
| 8 | 10:42.39 | 00:59:46.72 | 00:17:35.20 | 722 | 16853784 | 18585360 | 35439144 | 28845839 | 2149 | 26788 | 85254 |
| 16 | 10:43.54 | 01:16:27.32 | 01:05:23.05 | 1322 | 16074148 | 17341680 | 33415828 | 75899788 | 2942 | 895 | 93759 |
| 32 | 11:30.14 | 01:14:05.42 | 03:32:15.19 | 2489 | 15489724 | 17612732 | 33102456 | 42881359 | 120634 | 9111 | 134491 |
| 64 | 10:41.06 | 01:25:48.10 | 07:20:21.10 | 4924 | 15405012 | 16990268 | 32395280 | 39372702 | 61040 | 13887 | 64188 |
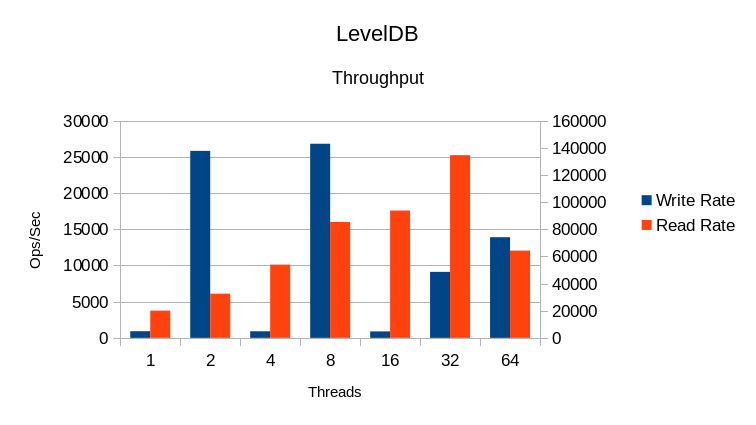
In this graph, the Write Rate is on the left Y-axis and the Read Rate uses the right Y-axis.
As is typical of LevelDB, the write speed is highly erratic. The read speed doesn't
scale linearly with threads, and it's clear that above 32 threads, the locking
overhead becomes so great that additional threads simply slow things down (negative
scaling).
Other items to note - even though the test duration is only 10 minutes, the actual running time is longer. This shows that the engine spends a significant amount of time cleaning up at the end of a test. Long cleanup times are a significant vulnerability; in an emergency shutdown a DB with a long cleanup time is likely to become corrupted if it doesn't have sufficient time to finish processing.
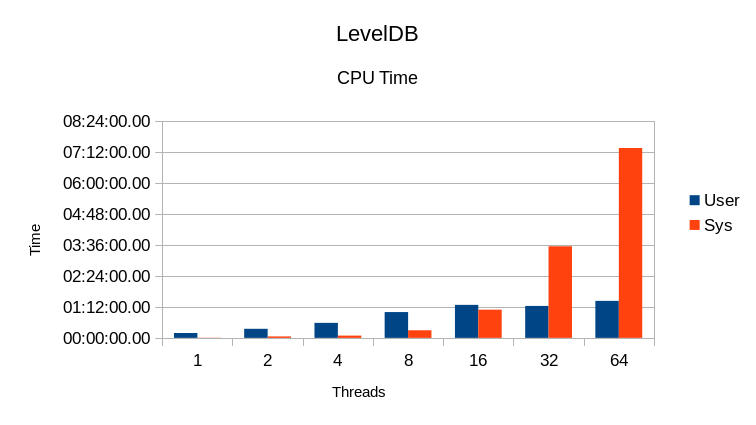
In the ideal case, since each run has a given number of reader threads plus one
writer thread, the CPU % column should read 200 / 300 / 500 / 900 / 1700 / 3300 / 6400.
(In the last case, since we only have 64 cores, the writer has to fight for CPU access with
the readers but in every other case all tasks should be able to fully utilize a CPU
core to themselves.) The CPU utilization here is far below ideal. This shows both
heavy locking overhead and significant I/O wait time.
Also in the ideal case, User CPU time should always be much greater than System time.
Here we see the System time increase drastically at 16 threads, and becoming several
times greater than User time at 64 threads. This also indicates heavy locking overhead.
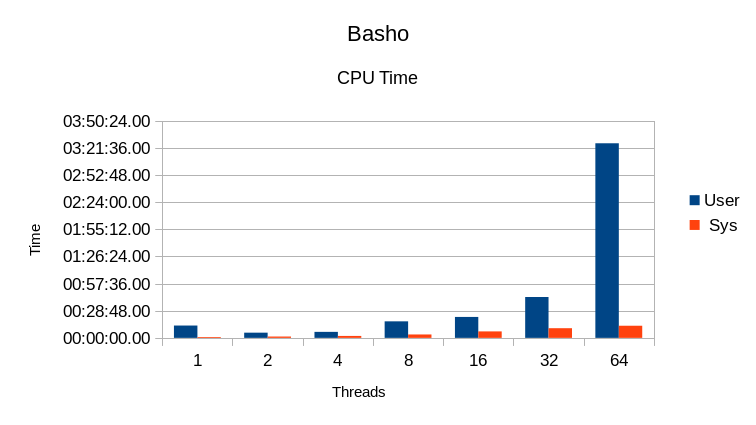
Basho LevelDB
| Threads | Run Time | CPU % | DB Size | Process Size | Total Size | Context Switches | Write Rate | Read Rate | |||
|---|---|---|---|---|---|---|---|---|---|---|---|
| Wall | User | Sys | Vol | Invol | |||||||
| 1 | 10:04.26 | 00:13:02.20 | 00:00:50.94 | 137 | 13085012 | 119212 | 13204224 | 4855337 | 2730 | 27152 | 142414 |
| 2 | 15:51.23 | 00:05:29.78 | 00:01:24.47 | 43 | 14006896 | 1035836 | 15042732 | 4654184 | 14146 | 27905 | 94 |
| 4 | 15:49.88 | 00:06:18.85 | 00:02:04.90 | 53 | 14110944 | 1965704 | 16076648 | 4718741 | 13304 | 28431 | 190 |
| 8 | 15:55.17 | 00:17:29.21 | 00:03:37.73 | 132 | 23496036 | 4399292 | 27895328 | 4716679 | 12295 | 28121 | 126877 |
| 16 | 15:44.48 | 00:22:13.60 | 00:06:51.74 | 184 | 23591320 | 8437516 | 32028836 | 5478414 | 17922 | 27390 | 116351 |
| 32 | 15:09.41 | 00:43:19.13 | 00:10:13.12 | 353 | 14448056 | 12363952 | 26812008 | 5701432 | 60864 | 30256 | 106381 |
| 64 | 15:29.80 | 03:26:13.51 | 00:12:50.38 | 1413 | 14246272 | 14032552 | 28278824 | 5042157 | 141044 | 25898 | 75883 |
Basho's fork of LevelDB shows extremely long cleanup times for these tests. That along
with the extremely low CPU utilization indicates severe I/O waits in these tests.
This is quite unusual considering that the writes are asynchronous and the 11GB database
easily fits in the server's 256GB RAM.
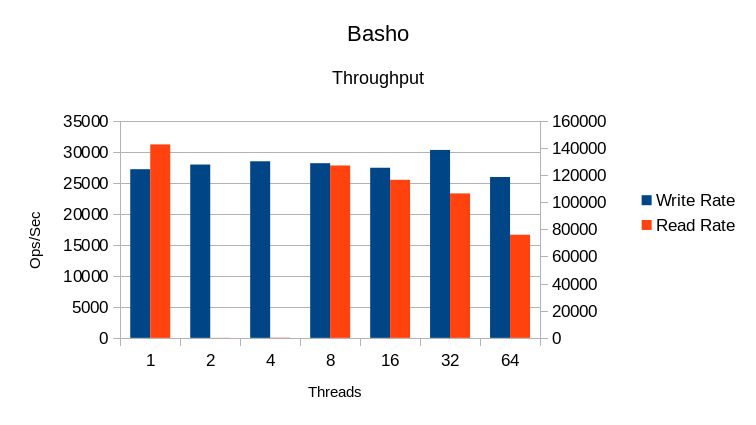
Aside from the
strange glitch in read performance at 2 and 4 threads, it shows a general decline in
read performance with increasing number of readers. The write speed is relatively
constant. Overall this DB is a poor choice for multi-threaded work.
Comparing the CPU usage to the throughput shows that additional threads just
cause the DB to spin, wasting cycles for each thread.
BerkeleyDB
| Threads | Run Time | CPU % | DB Size | Process Size | Total Size | Context Switches | Write Rate | Read Rate | |||
|---|---|---|---|---|---|---|---|---|---|---|---|
| Wall | User | Sys | Vol | Invol | |||||||
| 1 | 10:10.95 | 00:09:30.05 | 00:03:37.04 | 128 | 34931488 | 16073632 | 51005120 | 653643 | 2217 | 3550 | 50475 |
| 2 | 10:53.83 | 00:15:31.35 | 00:08:50.35 | 223 | 34930640 | 16085680 | 51016320 | 2735020 | 1857 | 3930 | 47219 |
| 4 | 10:49.24 | 00:26:38.88 | 00:15:38.22 | 390 | 34952156 | 16087608 | 51039764 | 22274852 | 2237 | 3754 | 73019 |
| 8 | 10:09.80 | 00:32:11.35 | 00:44:09.36 | 751 | 34931132 | 16081288 | 51012420 | 76970470 | 2126 | 2974 | 66445 |
| 16 | 10:11.06 | 00:25:39.69 | 02:16:41.90 | 1594 | 34934320 | 16071760 | 51006080 | 23633587 | 3319 | 2014 | 61253 |
| 32 | 10:16.70 | 00:23:14.77 | 05:00:23.84 | 3148 | 34945116 | 16065176 | 51010292 | 9084640 | 174998 | 1078 | 50525 |
| 64 | 10:06.52 | 00:35:26.97 | 09:48:26.09 | 6171 | 34934008 | 16060424 | 50994432 | 11150474 | 68473 | 449 | 34262 |
In OpenLDAP we have occasionally had reports of long shutdown times for slapd using
BDB. We see here that in some cases there is a lengthy cleanup time, although nowhere
near as bad as for BashoLevelDB.
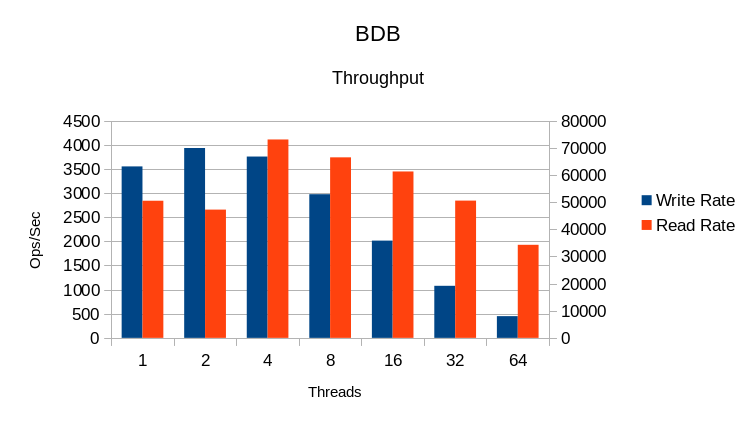
BDB runs into lock scaling issues at 8 threads and things go downhill quickly from there.
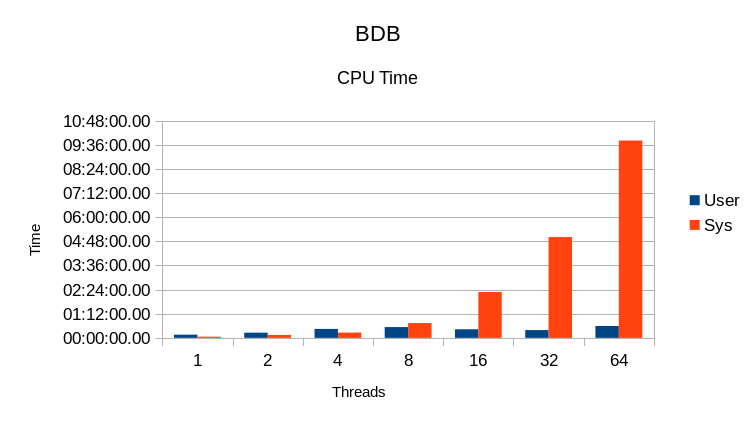
The behavior is exactly the opposite of what is desired - the System CPU time increases
with number of threads, instead of the User CPU time. Instead of getting useful
application work done, it is just spinning in mutex overhead.
HyperLevelDB
| Threads | Run Time | CPU % | DB Size | Process Size | Total Size | Context Switches | Write Rate | Read Rate | |||
|---|---|---|---|---|---|---|---|---|---|---|---|
| Wall | User | Sys | Vol | Invol | |||||||
| 1 | 10:17.20 | 00:14:46.85 | 00:01:47.94 | 161 | 15548040 | 14460184 | 30008224 | 432077 | 2602 | 63435 | 16741 |
| 2 | 10:05.32 | 00:18:43.46 | 00:02:55.43 | 214 | 18107372 | 16389472 | 34496844 | 3666264 | 2922 | 31637 | 20332 |
| 4 | 10:24.11 | 00:31:32.58 | 00:07:17.34 | 373 | 17498700 | 17424068 | 34922768 | 4160735 | 2862 | 35022 | 43237 |
| 8 | 10:28.28 | 00:53:27.79 | 00:12:49.46 | 633 | 16626288 | 17681188 | 34307476 | 15105478 | 2565 | 32361 | 70416 |
| 16 | 10:26.19 | 01:18:57.67 | 00:43:50.48 | 1176 | 16197856 | 16988044 | 33185900 | 59156005 | 4102 | 22540 | 126127 |
| 32 | 10:30.07 | 01:15:17.64 | 03:56:08.96 | 2965 | 15112364 | 15810176 | 30922540 | 27482892 | 184994 | 9967 | 162364 |
| 64 | 10:12.90 | 01:16:59.35 | 09:12:53.89 | 6166 | 15215340 | 15391140 | 30606480 | 7283399 | 82769 | 1753 | 114716 |
Aside from the sharp drop in write rate between the 1 and 2 reader case, not much
stands out in these results.
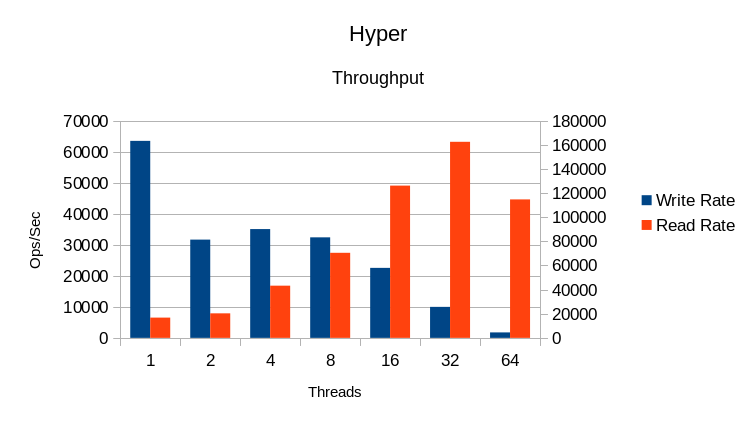
HyperLevelDB runs into locking overhead problems at 32 threads, and additional
threads beyond this point just slow things down.
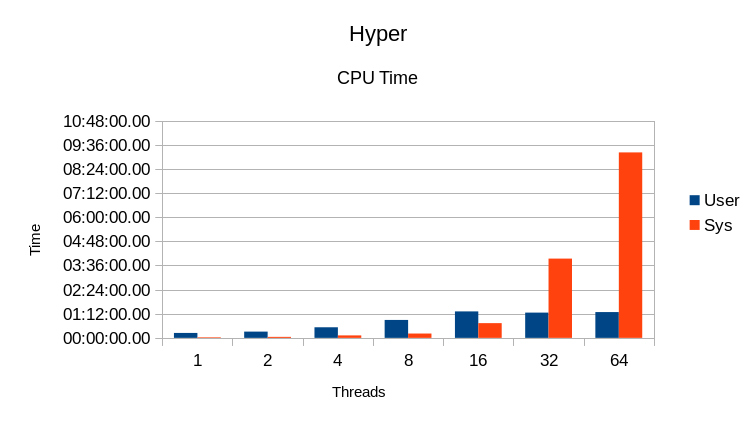
Somewhere between 16 and 32 threads the System CPU overhead gets very high as well.
Overall, increasing the number of readers causes a commensurate decrease in
writer throughput.
LMDB
| Threads | Run Time | CPU % | DB Size | Process Size | Total Size | Context Switches | Write Rate | Read Rate | |||
|---|---|---|---|---|---|---|---|---|---|---|---|
| Wall | User | Sys | Vol | Invol | |||||||
| 1 | 10:03.10 | 00:16:14.06 | 00:03:47.81 | 199 | 12587812 | 12590388 | 12590388 | 49 | 1537 | 48142 | 239740 |
| 2 | 10:02.00 | 00:23:38.66 | 00:06:21.47 | 299 | 12589356 | 12591940 | 12591940 | 1759 | 2600 | 37384 | 409245 |
| 4 | 10:01.56 | 00:32:08.06 | 00:17:48.70 | 498 | 12589572 | 12592184 | 12592184 | 140256 | 5774 | 30552 | 528349 |
| 8 | 10:01.77 | 01:01:26.58 | 00:27:56.55 | 891 | 12589572 | 12592228 | 12592228 | 2415620 | 9358 | 30775 | 1103808 |
| 16 | 10:01.82 | 02:11:52.53 | 00:37:24.96 | 1687 | 12589572 | 12592540 | 12592540 | 1499041 | 27988 | 29294 | 2615647 |
| 32 | 10:01.87 | 04:49:37.44 | 00:38:38.23 | 3272 | 12602972 | 12606132 | 12606132 | 910292 | 106739 | 23013 | 5080934 |
| 64 | 10:01.96 | 09:30:28.53 | 01:04:17.92 | 6326 | 12709900 | 12713708 | 12713708 | 206926 | 143083 | 13264 | 8192800 |
The CPU use here is fairly close to the ideal 200 / 300 / 500 / 900 / 1700 / 3300 / 6400.
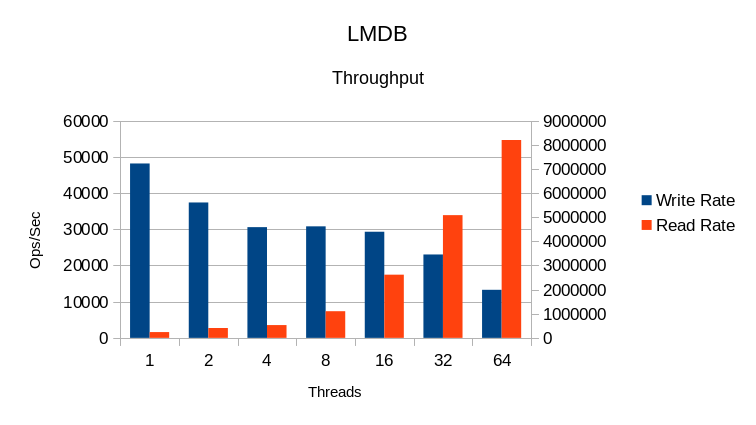
The write rate from 4 to 16 threads is basically unchanged while the read rate increases.
The drop in write rate at 64 threads is expected since the writer must compete with readers
for CPU time at that point. It was not expected at 32 threads since there are still 31 idle
cores on the system. More profiling will be needed to see what happened there.
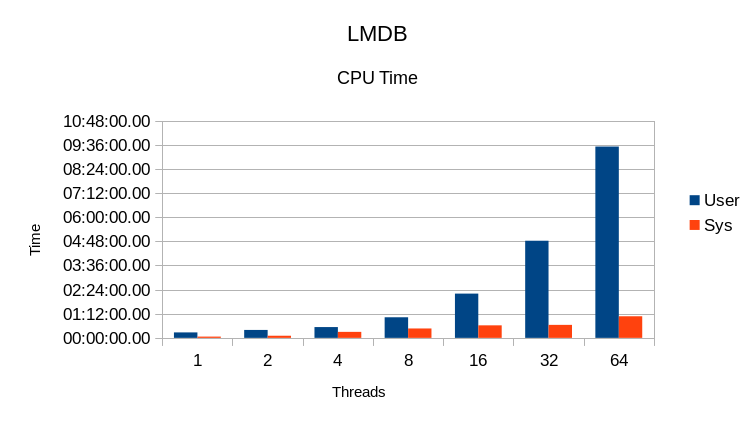
The CPU usage is as expected; User CPU time increases with the number of reader threads
and is proportional to the read throughput.
RocksDB
This is using RocksDB's default settings, except that the cache size was set to 32GB
and the write buffer size was set to 256MB.
| Threads | Run Time | CPU % | DB Size | Process Size | Total Size | Context Switches | Write Rate | Read Rate | |||
|---|---|---|---|---|---|---|---|---|---|---|---|
| Wall | User | Sys | Vol | Invol | |||||||
| 1 | 10:19.66 | 00:15:05.49 | 00:01:18.68 | 158 | 13525496 | 382828 | 13908324 | 231034 | 1663 | 35255 | 253714 |
| 2 | 11:04.16 | 00:18:20.26 | 00:07:37.98 | 234 | 15214124 | 20828308 | 36042432 | 3974906 | 1591 | 30240 | 22713 |
| 4 | 11:22.96 | 00:28:47.09 | 00:13:54.57 | 375 | 15660148 | 23118260 | 38778408 | 17358093 | 1769 | 30018 | 28758 |
| 8 | 11:38.54 | 01:00:23.61 | 00:16:52.67 | 663 | 15855532 | 23491976 | 39347508 | 46657001 | 2740 | 29674 | 208460 |
| 16 | 11:08.11 | 01:35:56.77 | 00:34:25.12 | 1170 | 15785324 | 23766452 | 39551776 | 140127583 | 4163 | 29590 | 203410 |
| 32 | 11:21.72 | 01:50:40.89 | 01:36:10.79 | 1820 | 15907288 | 23357424 | 39264712 | 242502418 | 20404 | 28876 | 144861 |
| 64 | 11:39.90 | 02:09:59.91 | 04:13:57.65 | 3291 | 16196980 | 22632116 | 38829096 | 246604572 | 49088 | 26033 | 76008 |
As with Basho there's a strange drop in read throughput at 2
and 4 threads, though it's not quite as drastic here. CPU utilization overall is
low, indicating a lot of I/O overhead. The runtime also indicates a significant
amount of cleanup time at the end of each test.
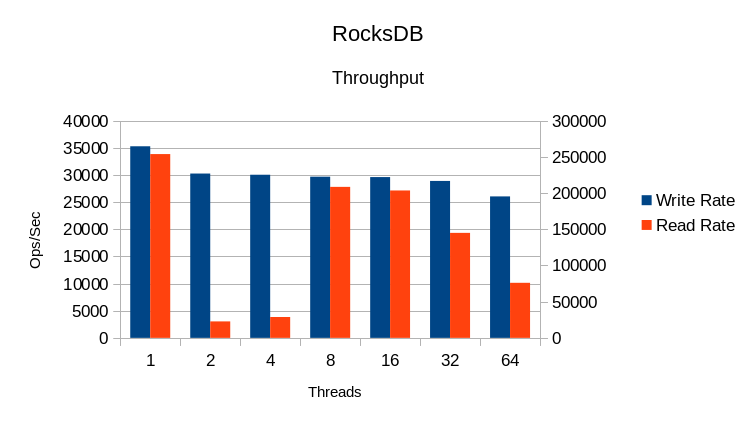
While the write rate is fairly steady, reads start to drop off at 16 threads and
adding more threads just slows things down from there.
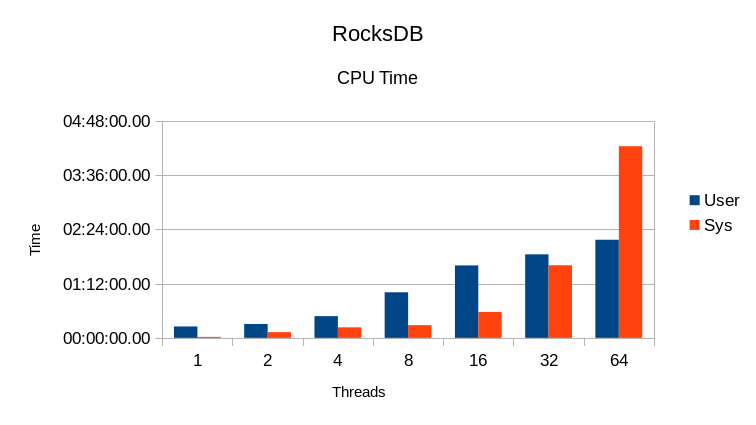
System CPU time gets out of hand past 16 threads.
RocksDBpfx
This is using all of the tuning settings as published in the original RocksDB
in-memory benchmark. As shown here, it takes over 40 settings to achieve best
performance.
$TIME ./db_bench.rocks --num_levels=6 --key_size=16 --prefix_size=16 --keys_per_prefix=0 --block_size=4096 --cache_size=$CACHE --cache_numshardbits=6 --compression_type=none --compression_ratio=1 --min_level_to_compress=-1 --disable_seek_compaction=1 --hard_rate_limit=2 --write_buffer_size=134217728 --max_write_buffer_number=2 --level0_file_num_compaction_trigger=8 --target_file_size_base=134217728 --max_bytes_for_level_base=1073741824 --sync=0 --disable_data_sync=1 --verify_checksum=1 --delete_obsolete_files_period_micros=314572800 --max_grandparent_overlap_factor=10 --max_background_compactions=4 --max_background_flushes=0 --level0_slowdown_writes_trigger=16 --level0_stop_writes_trigger=24 --statistics=0 --stats_per_interval=0 --stats_interval=$STATS --histogram=0 --use_plain_table=1 --open_files=-1 --mmap_read=1 --mmap_write=0 --memtablerep=prefix_hash --bloom_bits=10 --bloom_locality=1 --perf_level=0 --duration=$DUR --benchmarks=readwhilewriting --use_existing_db=1 --num=$NUM --threads=$THREADS --writes_per_second=$WRATE --duration=$DUR
| Threads | Run Time | CPU % | DB Size | Process Size | Total Size | Context Switches | Write Rate | Read Rate | |||
|---|---|---|---|---|---|---|---|---|---|---|---|
| Wall | User | Sys | Vol | Invol | |||||||
| 1 | 11:19.13 | 00:15:31.57 | 00:02:01.96 | 155 | 13958336 | 19184572 | 33142908 | 1530621 | 2341 | 29518 | 143077 |
| 2 | 11:42.98 | 00:23:55.84 | 00:03:47.22 | 236 | 14273048 | 20997544 | 35270592 | 1599541 | 3442 | 22199 | 262740 |
| 4 | 11:32.00 | 00:37:03.53 | 00:11:30.89 | 421 | 14102164 | 21605132 | 35707296 | 1209638 | 5375 | 25063 | 399082 |
| 8 | 13:00.94 | 01:14:49.76 | 00:14:12.12 | 684 | 13739348 | 21791576 | 35530924 | 1456330 | 11288 | 21828 | 845523 |
| 16 | 11:35.51 | 02:34:35.01 | 00:14:16.86 | 1456 | 14252980 | 21198204 | 35451184 | 1378890 | 64921 | 31422 | 2035618 |
| 32 | 11:33.73 | 05:09:52.76 | 00:17:54.52 | 2835 | 14239260 | 21515240 | 35754500 | 1690116 | 279869 | 24594 | 4333791 |
| 64 | 11:48.49 | 09:57:25.88 | 00:39:28.56 | 5393 | 14325896 | 21539212 | 35865108 | 527183 | 167314 | 24602 | 7818390 |
The various performance options definitely help, although they haven't eliminated the
cleanup time at the end of the test. In some cases it's actually worse than for the
default settings.
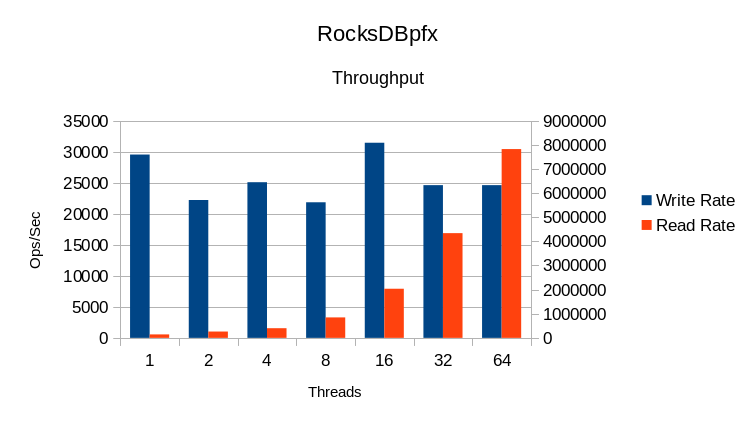
The read rate scales linearly with the number of threads, which is very good.
The write rate is relatively unaffected by the number of readers, which is
also very good.
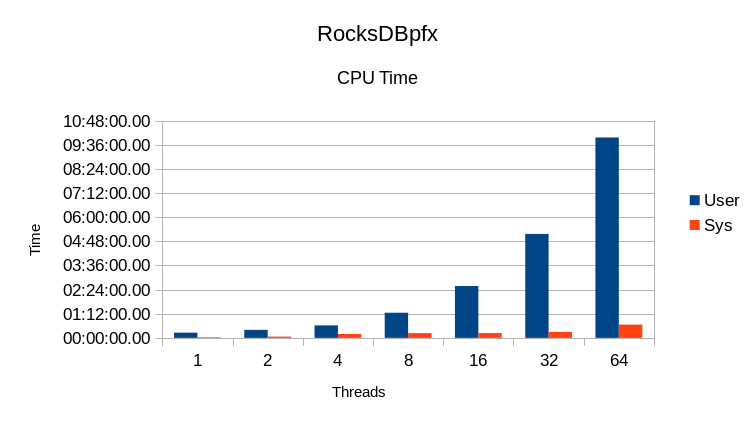
The User CPU time is proportional to the read rate, and the System CPU time
remains small. Again, these are very good results.
TokuDB
| Threads | Run Time | CPU % | DB Size | Process Size | Total Size | Context Switches | Write Rate | Read Rate | |||
|---|---|---|---|---|---|---|---|---|---|---|---|
| Wall | User | Sys | Vol | Invol | |||||||
| 1 | 10:05.00 | 00:09:19.32 | 00:01:04.51 | 103 | 12377020 | 13867540 | 26244560 | 633989 | 1800 | 266 | 72934 |
| 2 | 10:08.83 | 00:14:47.05 | 00:05:33.55 | 200 | 12473960 | 14190944 | 26664904 | 1914432 | 1086 | 257 | 83785 |
| 4 | 10:11.02 | 00:26:19.24 | 00:10:43.91 | 363 | 12570772 | 14518040 | 27088812 | 31737888 | 957 | 247 | 119069 |
| 8 | 10:10.19 | 00:34:31.22 | 00:27:37.15 | 611 | 12700364 | 14750404 | 27450768 | 102760739 | 1359 | 237 | 123622 |
| 16 | 10:09.40 | 00:25:33.81 | 02:01:30.03 | 1447 | 12863188 | 15026356 | 27889544 | 51746085 | 4088 | 230 | 93177 |
| 32 | 10:10.02 | 00:21:13.04 | 04:43:10.17 | 2993 | 12941136 | 15099288 | 28040424 | 18567628 | 114165 | 203 | 67996 |
| 64 | 10:08.03 | 00:30:29.41 | 09:12:14.36 | 5750 | 12929692 | 15040012 | 27969704 | 18162776 | 99868 | 127 | 44633 |
We're told that something is misconfigured in our TokuDB driver, but unfortunately there
is no documentation on what proper settings might be. As it is, the write rates here
are ridiculously slow and the code is both I/O bound and lock bound.
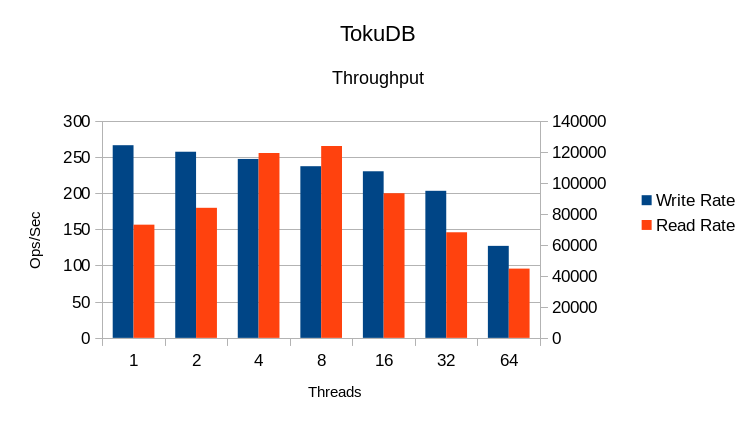
Increasing threads beyond 8 just slows everything down.
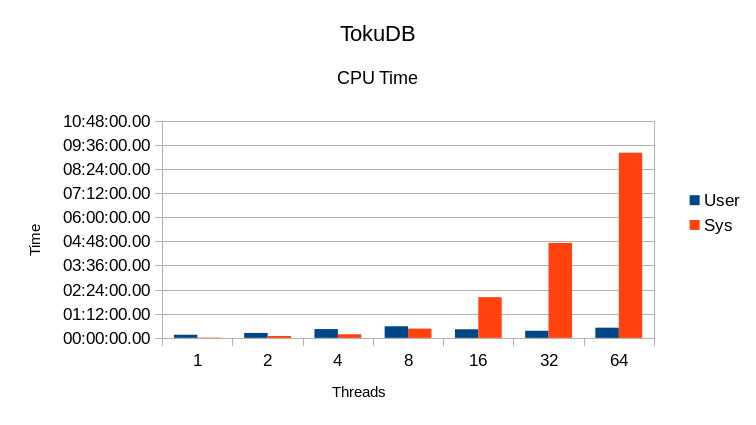
The System CPU time gets out of hand above 8 threads. This indicates heavy locking overhead.
WiredTiger LSM
| Threads | Run Time | CPU % | DB Size | Process Size | Total Size | Context Switches | Write Rate | Read Rate | |||
|---|---|---|---|---|---|---|---|---|---|---|---|
| Wall | User | Sys | Vol | Invol | |||||||
| 1 | 10:18.83 | 00:20:27.41 | 00:03:32.60 | 232 | 16856992 | 13225240 | 30082232 | 220984 | 1910 | 697 | 35661 |
| 2 | 10:04.80 | 00:28:55.59 | 00:01:17.79 | 299 | 12201732 | 13170140 | 25371872 | 114333 | 2356 | 1748 | 83702 |
| 4 | 10:04.58 | 00:47:38.72 | 00:03:08.41 | 504 | 12278616 | 13359204 | 25637820 | 296681 | 4239 | 2202 | 151433 |
| 8 | 10:10.88 | 01:25:30.81 | 00:05:22.78 | 892 | 12471700 | 13698460 | 26170160 | 953444 | 16179 | 2154 | 284496 |
| 16 | 10:04.80 | 02:41:45.85 | 00:08:18.44 | 1687 | 12287368 | 14277704 | 26565072 | 2197247 | 207605 | 1789 | 404349 |
| 32 | 10:04.99 | 05:13:24.77 | 00:10:58.64 | 3217 | 12376328 | 13361324 | 25737652 | 3657026 | 310230 | 1237 | 328547 |
| 64 | 10:05.17 | 07:55:52.22 | 02:24:17.31 | 6148 | 12359716 | 13345940 | 25705656 | 4547381 | 61186756 | 817 | 294251 |
Reads scale fairly well up to 16 threads. The write rates are quite slow; it's
unusual to see the write rate ramp up before ramping down again as it does here.
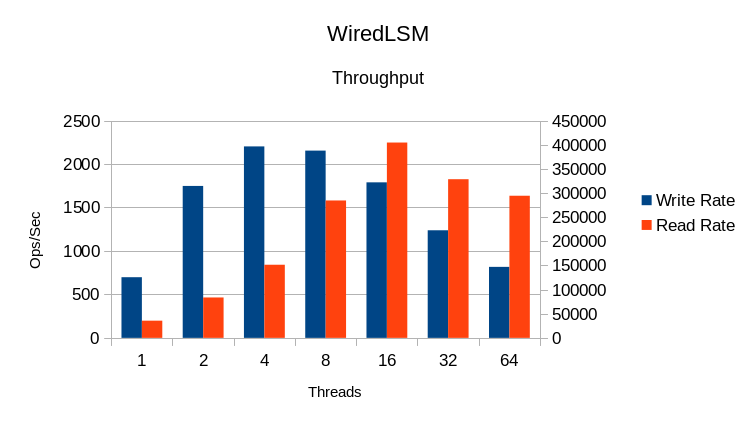
Comparing throughput to CPU use implies that this library uses its own
locking mechanism, not just the system's mutexes.
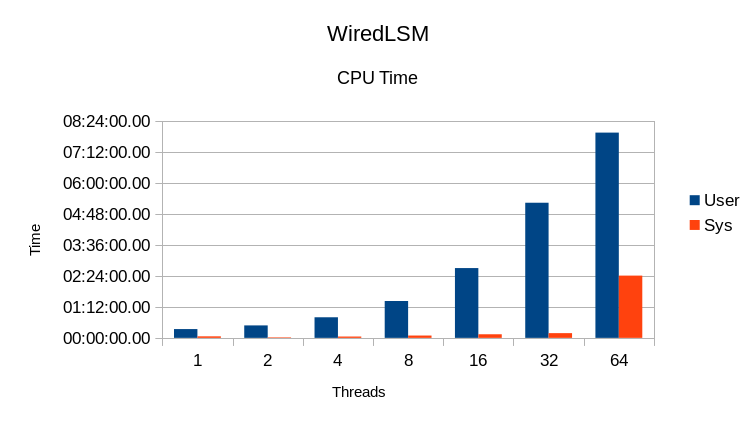
The increase in System CPU at 64 threads indicates heavy mutex overhead.
WiredTiger Btree
| Threads | Run Time | CPU % | DB Size | Process Size | Total Size | Context Switches | Write Rate | Read Rate | |||
|---|---|---|---|---|---|---|---|---|---|---|---|
| Wall | User | Sys | KB | KB | Vol | Invol | |||||
| 1 | 15:30.64 | 00:14:01.12 | 00:07:22.39 | 137 | 23818836 | 18416052 | 42234888 | 774344 | 1864 | 30223 | 93085 |
| 2 | 13:25.07 | 00:21:47.42 | 00:09:06.81 | 230 | 23818844 | 18889116 | 42707960 | 1760746 | 1976 | 31933 | 213321 |
| 4 | 12:30.88 | 00:30:46.97 | 00:18:00.85 | 389 | 23818844 | 18657408 | 42476252 | 4576807 | 1613 | 26682 | 300084 |
| 8 | 12:22.53 | 01:03:23.17 | 00:21:17.12 | 684 | 23818844 | 18597748 | 42416592 | 7664991 | 5899 | 24349 | 549349 |
| 16 | 12:31.51 | 02:11:38.13 | 00:23:29.90 | 1238 | 23818844 | 18415612 | 42234456 | 11727794 | 28631 | 20807 | 842162 |
| 32 | 12:23.78 | 03:25:13.55 | 01:20:51.76 | 2307 | 23818836 | 17554408 | 41373244 | 19375216 | 230283 | 9809 | 668958 |
| 64 | 12:29.11 | 05:42:55.20 | 02:33:29.72 | 3976 | 23818836 | 17024528 | 40843364 | 29848253 | 301760 | 3967 | 641151 |
This DB shows significant cleanup time at the end of each test. Also it appears
to have heavy lock overhead from 4 threads on up, based on the low CPU usage.
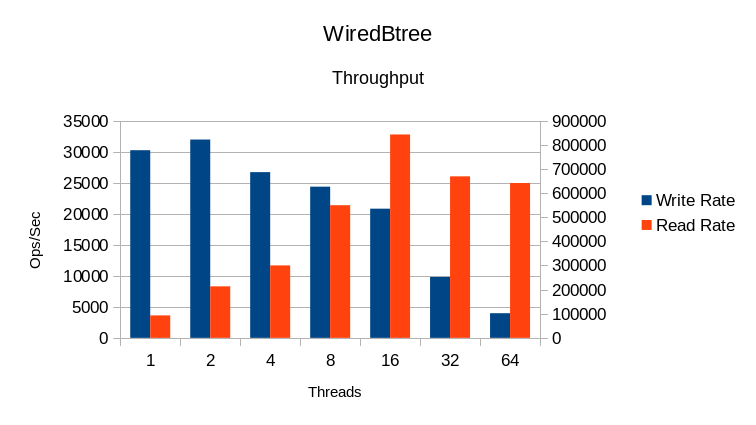
The read rate
scales well up to about 8 threads, then tapers off. Additional threads past 16
just slow things down.
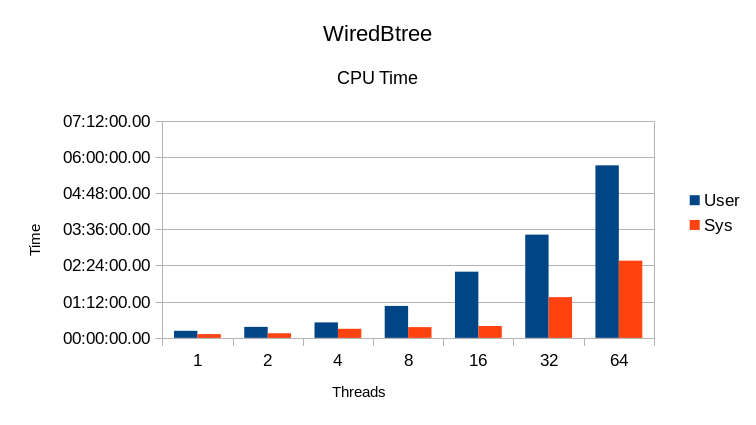
The System CPU time is noticeable at all load levels, but gets out of hand
past 16 threads.
NUMA Considerations
The amount of System CPU time for LMDB in these tests seemed excessively high.
Using oprofile showed that most of the System time was due to reshuffling of
memory pages between different NUMA nodes. This particular machine has 8 nodes,
or 8 different memory zones. 8 CPU cores reside in each node. While the
entire database is small enough to fit into a single node, and will generally
be allocated that way by the initial loading phase, that means that 56 of the
cores will be at a significant disadvantage when accessing the database
because all of their references will be to a remote node. Further testing
was done using NUMA interleaving to measure its performance impact - see
the Scaling/NUMA writeup for the results.
The definition of "what fits in memory" also varies wildly depending on whose DB you're talking about, what kind of workload you throw at it, and how you tune the DB engine. One of the reasons for using an embedded DB is not only that it has a small footprint in terms of code and resource usage, but also in terms of administration and maintenance. Some of these DBs have quite complex configurations that must be carefully tuned in order to obtain usable performance; they seem to have lost the point of simplicity in their quest for performance. With LMDB no tuning is required. If you're looking to jump on the In-Memory bandwagon, there's only one viable choice.
The software versions we used:
Software revisions used:

violino:/home/software/leveldb> g++ --version
g++ (Ubuntu 4.8.2-19ubuntu1) 4.8.2
Copyright (C) 2013 Free Software Foundation, Inc.
This is free software; see the source for copying conditions.  There is NO
warranty; not even for MERCHANTABILITY or FITNESS FOR A PARTICULAR PURPOSE.

violino:/home/software/leveldb> git log -1 --pretty=format:"%H %ci" master
e353fbc7ea81f12a5694991b708f8f45343594b1 2014-05-01 13:44:03 -0700

violino:/home/software/basho_leveldb> git log -1 --pretty=format:"%H %ci" develop
d1a95db0418d4e17223504849b9823bba160dfaa 2014-08-21 15:41:50 -0400

violino:/home/software/db-5.3.21> ls -l README
-rw-r--r-- 1 hyc hyc 234 May 11  2012 README

violino:/home/software/HyperLevelDB> git log -1 --pretty=format:"%H %ci" master
02ad33ccecc762fc611cc47b26a51bf8e023b92e 2014-08-20 16:44:03 -0400

violino:~/OD/mdb> git log -1 --pretty=format:"%H %ci"
a054a194e8a0aadfac138fa441c8f67f5d7caa35 2014-08-24 21:18:03 +0100

violino:/home/software/rocksdb> git log -1 --pretty=format:"%H %ci"
7e9f28cb232248b58f22545733169137a907a97f 2014-08-29 21:21:49 -0700

violino:/home/software/ft-index> git log -1 --pretty=format:"%H %ci" master
f17aaee73d14948962cc5dea7713d95800399e65 2014-08-30 06:35:59 -0400

violino:/home/software/wiredtiger> git log -1 --pretty=format:"%H %ci"
1831ce607baf61939ddede382ee27e193fa1bbef 2014-08-14 12:31:38 +1000
All of the engines were built with compression disabled; compression was not used in the RocksDB test either. Some of these engines recommend/require use of a non-standard malloc library like Google tcmalloc or jemalloc. To ensure as uniform a test as possible, all of the engines in this test were built to use the standard libc malloc.