Symas Corp., August 2018
Since the point of these tests is to explore the performance of the Optane SSDs, the tests are configured much like the previous ondisk benchmark, using a database approximately 5x larger than RAM, to minimize the impact of caching in RAM and force the storage devices to be exercised. However, there are some twists to this as well: The Optane SSDs on NVMe can also be operated as if they were system RAM. The Optane technology still has higher latency than DRAM, but as we'll see, there's still a performance benefit to using this mode.
The hardware for these tests was graciously provided by our friends at Packet and system support was provided by Intel. The machine was based on an Intel S2600WFT motherboard with a pair of 16 core/32 thread Intel Xeon Gold 6142 processors and 192GB DDR4-2666 DRAM. Storage being tested included a 4 TB DC P4500 TLC NAND-Flash SSD and three 750GB DC P4800X Optane SSDs. The machine had Ubuntu 16.04 installed, with a 4.13.0-41-generic kernel. The software versions being used are LMDB 0.9.70 and RocksDB 5.7.3, both compiled from their respective git repos. (Note that LMDB 0.9.70 is the revision in the mdb.master branch, not an officially released version. The main difference is the addition of support for raw devices.)
Test Overview
Prior tests have already illustrated how performance varies with record sizes. In
these tests we're strictly interested in the relative performance across the different
storage types so we're only testing with a single record size.
We're using the ext4 filesystem in these tests, configured once with
journaling enabled and once with journaling disabled. Each test begins
by loading the data onto a freshly formatted filesystem. We use a 750GB
partition on the 4TB Flash SSD, to ensure that the filesystem metadata
overhead is identical on the Flash and Optane filesystems.
Additionally, we test LMDB
on raw block devices, with no filesystem at all, to explore how much overhead the
filesystems impose. RocksDB doesn't support running on raw block devices, so it
is omitted from those tests.
The test is run using 80 million records with 16 byte keys and 4000 byte values, for
a target DB size of around 300GB. The system is set so that only 64GB RAM is
available during the test run. After the data is loaded a readwhilewriting test is
run multiple times in succession. The number of reader threads is set to 1, 2, 4, 8, 16, 32, and
64 threads for each successive run. (There is always only a single writer.)
All of the threads operate on randomly selected records in the database.
The writer performs updates to existing records; no records are added or deleted
so the DB size should not change much during the test. The results are detailed in the following sections.
Loading the DB
Here are the stats collected from initially loading the DB for the various storage configurations.
| Storage | Load Time | CPU | DB Size | Context Switches | FS Ops | ||||||
|---|---|---|---|---|---|---|---|---|---|---|---|
| LMDB | Journal | Wall | User | Sys | % | KB | Vol | Invol | In | Out | Write Amp |
| Flash/Ext4 | Y | 11:50.91 | 01:15.70 | 09:40.36 | 92 | 322683976 | 5910595 | 1303 | 2640 | 840839736 | 10.5104967 |
| Flash/Ext4 | N | 13:21.04 | 01:16.69 | 11:01.86 | 92 | 322683976 | 8086767 | 1241 | 3696 | 946659568 | 11.8332446 |
| Flash | N | 17:25.23 | 03:29.26 | 04:11.36 | 44 | 80669411 | 1346 | 645369800 | 645487344 | 8.0685918 | |
| Optane/Ext4 | Y | 14:20.99 | 01:12.78 | 12:09.88 | 93 | 322683976 | 9991458 | 1170 | 552 | 928896808 | 11.6112101 |
| Optane/Ext4 | N | 15:11.10 | 01:16.72 | 12:49.09 | 92 | 322683976 | 10487638 | 1377 | 1080 | 1029364408 | 12.8670551 |
| Optane | N | 20:26.19 | 03:30.62 | 03:55.97 | 36 | 80670953 | 1305 | 645367344 | 645547472 | 8.0693434 | |
| RocksDB | Journal | Wall | User | Sys | % | KB | Vol | Invol | In | Out | |
| Flash/Ext4 | Y | 15:00.44 | 13:01.27 | 11:45.63 | 165 | 318790584 | 231768 | 3184 | 11400 | 1265319232 | 15.8164904 |
| Flash/Ext4 | N | 14:30.45 | 12:53.43 | 10:46.62 | 163 | 318790584 | 215318 | 2786 | 11016 | 1265362424 | 15.8170303 |
| Optane/Ext4 | Y | 02:13:40.00 | 13:51.74 | 11:14.07 | 18 | 318790328 | 339737 | 7549 | 11088 | 1265319000 | 15.8164875 |
| Optane/Ext4 | N | 02:13:40.00 | 13:47.29 | 10:49.81 | 18 | 318790328 | 337922 | 7598 | 11256 | 1265364360 | 15.8170545 |
The "Wall" time is the total wall-clock time taken to run the loading process. Obviously shorter times are faster/better. The actual CPU time used is shown for both User mode and System mode. User mode represents time spent in actual application code; time spent in System mode shows operating system overhead where the OS must do something on behalf of the application, but not actual application work. In a pure RAM workload where no I/O occurs, ideally the computer should be spending 100% of its time in User mode, processing the actual work of the application. Since this workload is 5x larger than RAM, it's expected that a significant amount of time is spent in System mode performing actual I/O.
The "CPU" column is the ratio of adding the User and System time together, then dividing by the Wall time, expressed as a percentage. This shows how much work of the DB load occurred in background threads. Ideally this value should be 100, all foreground and no background work. If the value is greater than 100 then a significant portion of work was done in the background. If the value is less than 100 then a significant portion of time was spent waiting for I/O. When a DB engine relies heavily on background processing to achieve its throughput, it will bog down more noticeably when the system gets busy. I.e., if the system is already busy doing work on behalf of users, there will not be any idle system resources available for background processing.
The "Context Switches" columns show the number of Voluntary and Involuntary context switches that occurred during the load. Voluntary context switches are those which occur when a program calls a function that can block - system calls, mutexes and other synchronization primitives, etc. Involuntary context switches occur e.g. when a CPU must handle an interrupt, or when the running thread's time slice has been fully consumed. LMDB issues write() system calls whenever it commits a transaction, so there are a lot of voluntary context switches here. However, not every write() results in a context switch - this depends largely on the behavior of the OS filesystem cache. RocksDB is configured with a large cache (32GB, one half of available RAM) as well as a large write buffer (256MB) so it has far fewer voluntary context switches. But since this workload is dominated by I/O, the CPU overhead of LMDB's context switches has little impact on the overall runtime.
The "FS Ops" columns show the number of actual I/O operations performed, which is usually different from the
number of DB operations performed. Since the loading task is "write-only" we would expect few, if any, input operations.
However, since the DB is much larger than RAM, it's normal for some amount of metadata to need to be re-read during
the course of the run, as the written data pushes other information out of the filesystem cache. The number of
outputs is more revealing, as it directly shows the degree of write amplification occurring. There are only 80 million
DB writes being performed, but there are far more than 80 million actual writes occurring in each run.
The results with the raw block device shows that the filesystem adds 25% more writes than the DB itself.
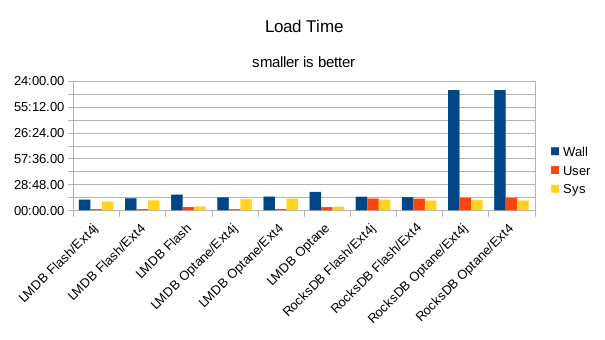
There are a few unexpected results here. The LMDB loads actually ran slower with
the filesystem journal turned off. Also, the LMDB loads on the raw block device also
ran slower than with a filesystem. The I/O statistics imply that the block device wasn't
caching any of the device reads. RocksDB has a serious performance issue on the Optane
filesystems, taking over 2 hours to load the data. There's no explanation for that yet.
Here's the load times plotted again, without the 2 hour outliers.
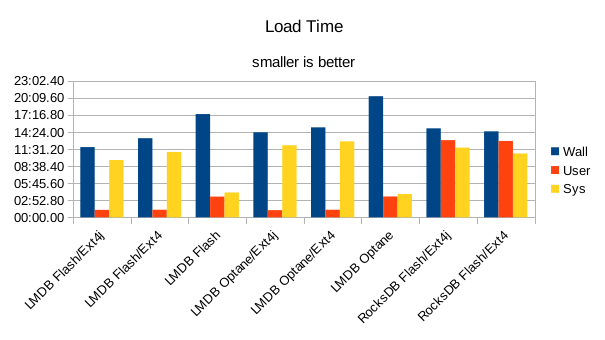
With LMDB on the raw block device, each write of a record results in an immediate write to the device, which always causes a context switch. So for 80 million records there are at least 80 million voluntary context switches. In general, even though this is a purely sequential workload, RocksDB performs more filesystem writes per database write than LMDB, and usually more filesystem reads. The latter is somewhat surprising because LSM-based designs are supposed to support "blind writes" - i.e., writing a new record shouldn't require reading any existing data - that's supposed to be one of the features that makes them "write-optimized." This LSM advantage is not in evidence here.
Overall, the specs for the Optane P4800X show 11x more random write IOPS and faster latency than the Flash P4500 SSD, but all of the load results here are slower for the P4800X than for the Flash SSD. Again, we have no explanation for why the results aren't more reflective of the drive specs. At a guess, it may be due to wear on the SSDs from previous users. It was hoped that doing a fresh mkfs before each run, which also explicitly performed a Discard Blocks step on the device, would avoid wear-related performance issues but that seems to have had no effect.
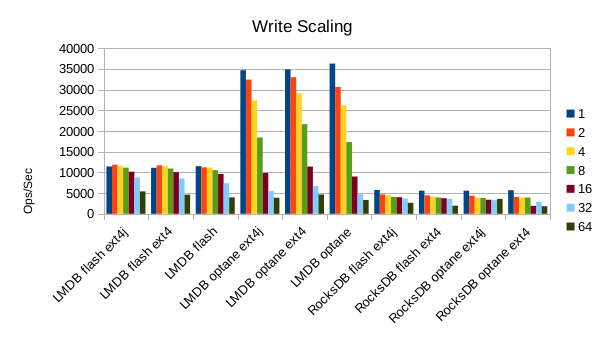
Write throughput for RocksDB is uniformly slow, regardless of whether using the Flash or Optane SSD.
In contrast, LMDB shows the performance difference that Optane offers, quite dramatically, with
peak random write throughputs up to 3.5x faster on Optane than on Flash. Using the raw block device
also yields a slightly higher write throughput than using the ext4 filesystem.
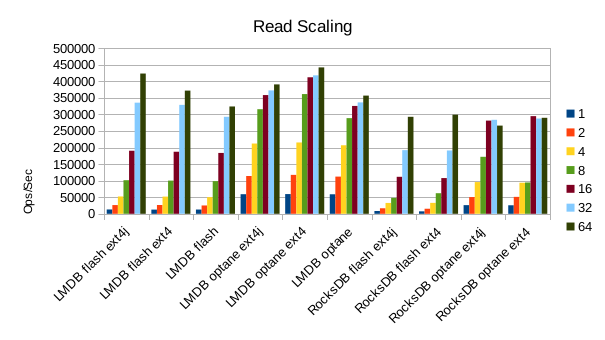
The difference in read throughput between Flash and Optane isn't so great at the peak workload of 64 reader threads,
but there are more obvious differences at the greater numbers of threads. With LMDB on Flash, doubling the number
of reader threads essentially doubles throughput, except at 64 readers where the increase is much smaller.
The way the results bunch up at thread counts of 8 or more for LMDB on Optane imply that the I/O subsystem gets bottlenecked,
and there's no headroom for further doubling. RocksDB's peak is still about the same (or slightly slower)
on Optane as on Flash, and still slower than LMDB.
Test results using the Optane SSD as RAM are on the next page.
90318154 Jul 27 01:28 data.tgz Command scripts, output, atop record
Throughput
The results for running the actual readwhilewriting test with varying numbers of readers are shown here.
Conclusion
When using LMDB, the LMDB engine will never be the bottleneck in your workloads. When you move
onto faster storage technologies, LMDB will let you utilize the full potential of that hardware.
Inferior technologies like LSM designs won't.
Files
The files used to perform these tests are all available for download.
LibreOffice spreadsheet with tabulated results here.
The source code for the benchmark drivers
is all on GitHub.
We invite you to run these tests yourself and report your results back to us.