Symas Corp., November 2014
This selection of engines is interesting because they're all closely related in one way or another: obviously the LevelDB databases are all of a breed, all using Log Structured Merge (LSM) trees as their main data store. LMDB and BerkeleyDB are both Btree engines. WiredTiger comes from the people who created BerkeleyDB, and it offers both LSM and Btree engines. Both LMDB and TokuDB's APIs are based on the BerkeleyDB API. TokuDB is unique here, being the only engine implementing Fractal Trees. (And since Fractal Trees are patented, they will probably remain the sole implementation for some time to come...)
The RocksDB test focuses on multithreaded read performance for a database that is over 5 times larger than the size of RAM. As such, all of the tests shown here are I/O bound.
The hardware for these tests was graciously provided by the fine folks at StorageReview.com. Tests were conducted on two different test environments - a virtual machine under VMWare ESXi 5.5 and a physical machine. Both machines are running Centos7 with kernel Linux version 3.10.0-123.el7.x86_64. The physical server was a Dell PowerEdge R720 with a pair of Intel Xeon E5-2690 CPUs (8 cores @ 3.0GHz, 16 cores total). The VM had a pair of Intel Xeon E5-4650 CPUs (8 cores @ 2.7GHz, 16 cores total). Both machines had 32GB of RAM and 400GB of Flash storage. The flash array was a Fusion IO ioDrive2 and was run with an XFS filesystem.
Test Overview
The RocksDB report only tested one data value size (10 byte keys, 800 byte values). However,
the performance of each DB engine varies quite a bit based on the size of data values. For
completeness' sake we rerun each test using 16 byte keys and value sizes of 24, 96, 384,
768, 2000, and 4000 bytes. Each test is also run with 1, 2, 4, 8, 16, 32, and 64 concurrent
reader threads, so the set of results is quite large. Also, since each test was run on
both the VM and the physical server, you can see the performance cost imposed by
virtualization overhead.
As we've written a few other times, at small value sizes the overhead of the Copy-on-Write Btree approach in LMDB is very high, much higher than for the LSM-based engines. At larger value sizes the COW overhead is proportionally smaller, and the LSM write amplification starts to dominate.
Due to the large number of test variants, each was only run for 20 minutes. We plan to do longer runtime tests in the future, on just a single test configuration.
For expedience, we're only including the summary graphs in this web report. The full details, raw data, spreadsheets, and command scripts are available for download.
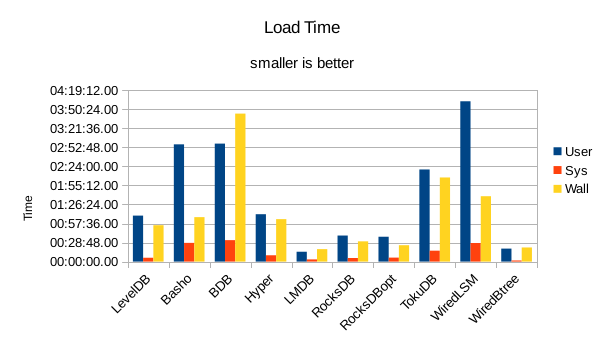
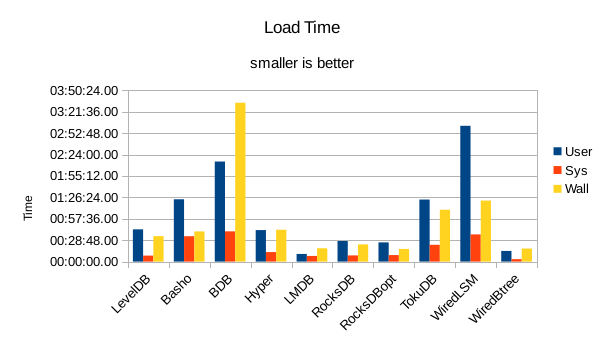
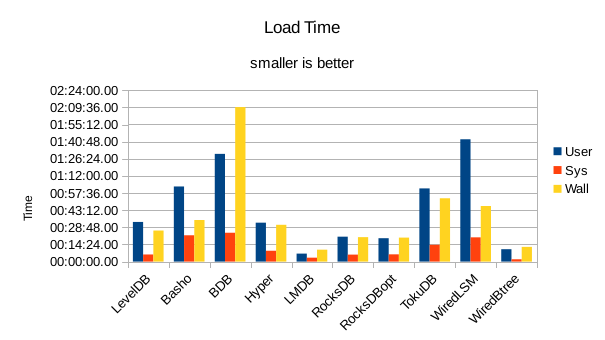
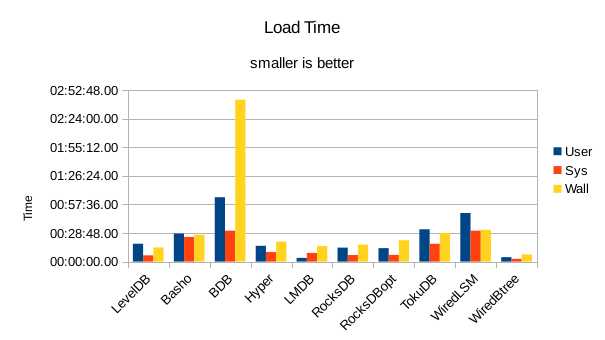
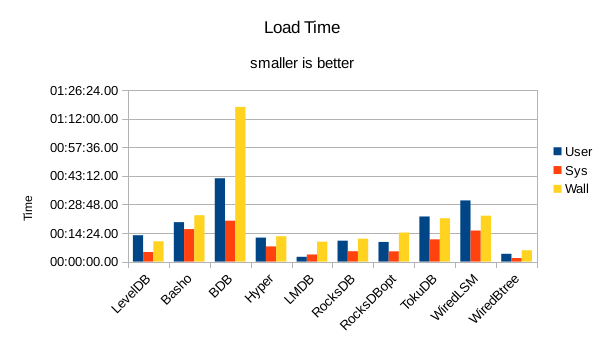
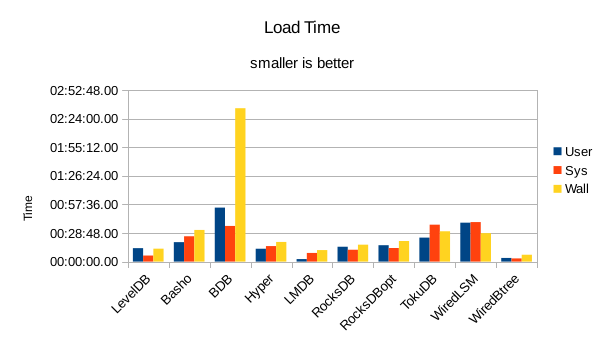
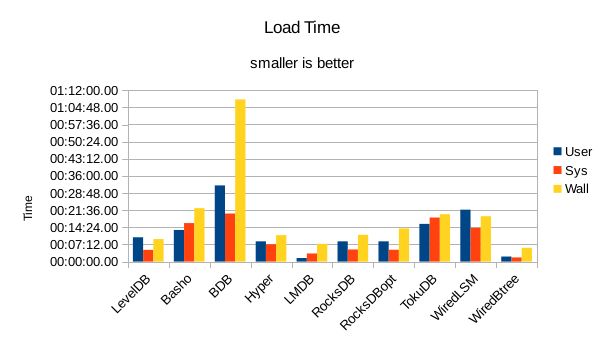
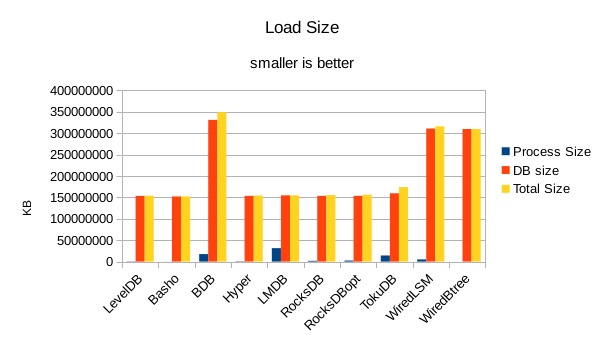
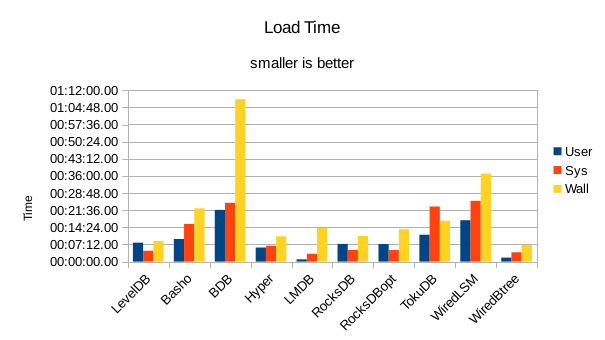
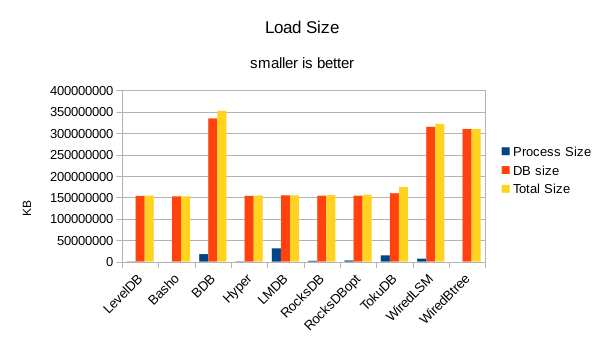
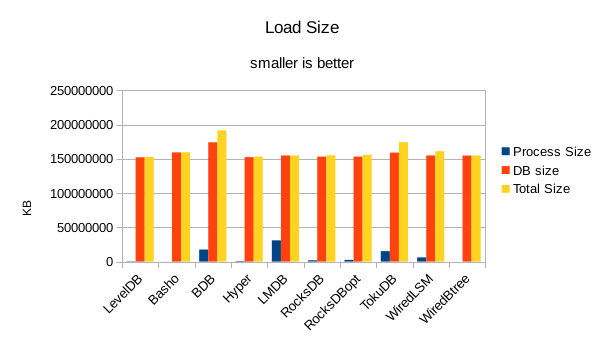
These charts summarize the process of initially loading the database for each DB engine.
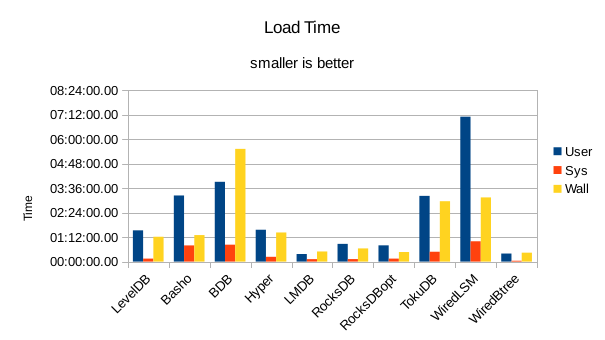
The times are the User CPU time, System CPU time, and wall clock time for the load task.
In all of these tests, LMDB and WiredTiger Btree take turns at being fastest.
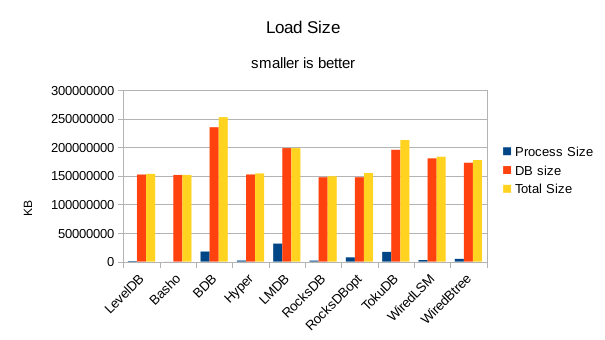
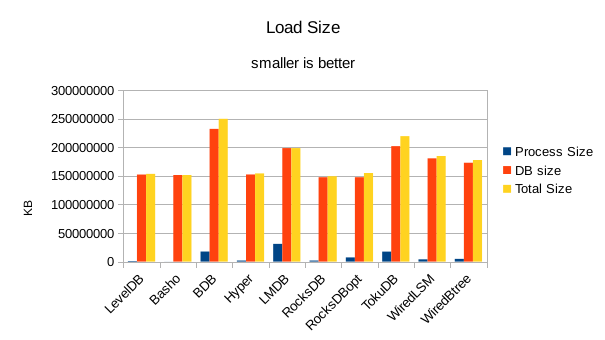
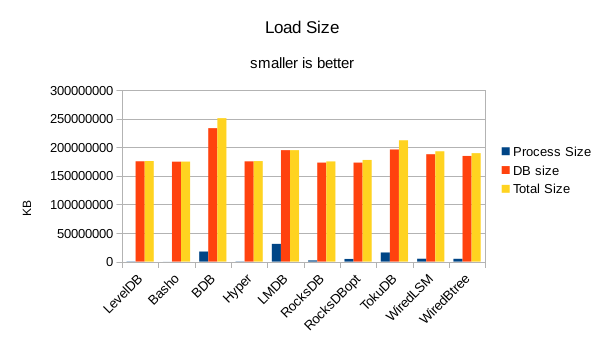
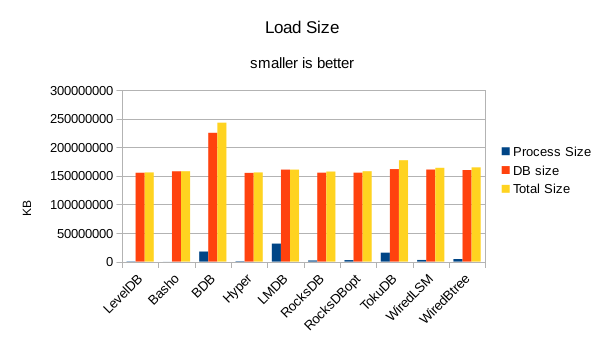
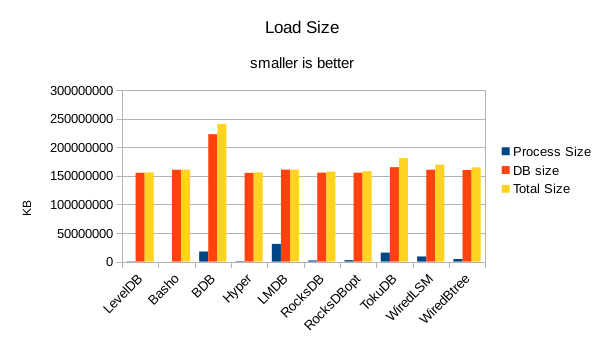
For the load size, the DB size on disk is most relevant. All of the LevelDB-derived engines
are very space efficient here. For LMDB, there is an 8 byte header per record, so for 4 billion
records that's 32GB of additional disk space being consumed in this test.
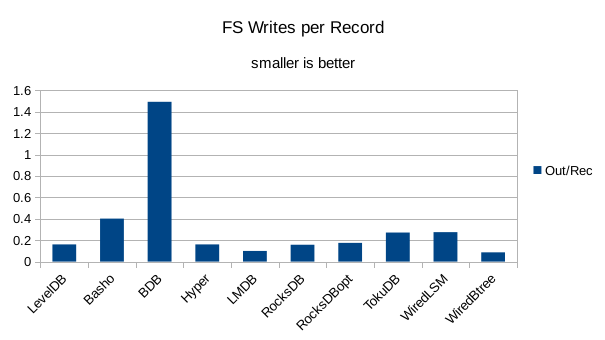
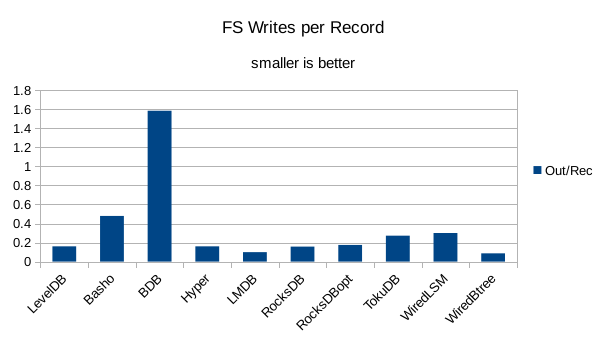
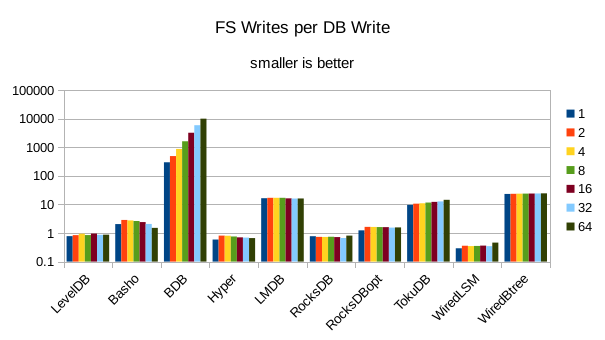
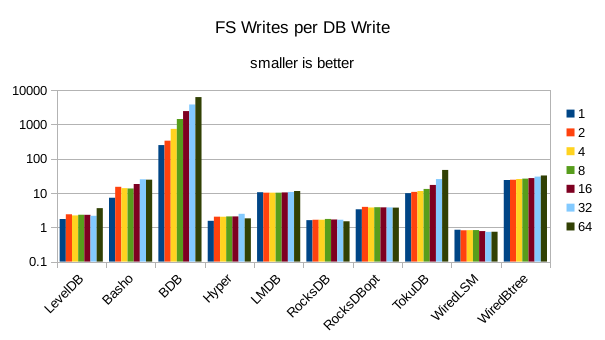
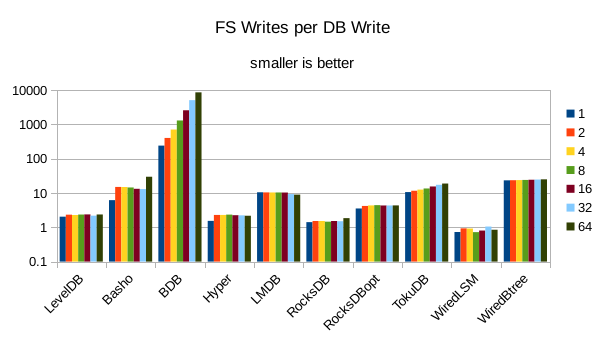
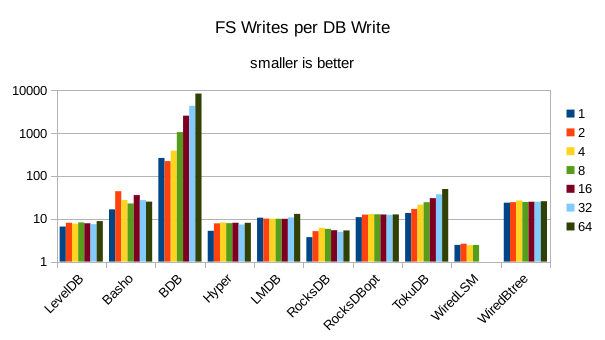
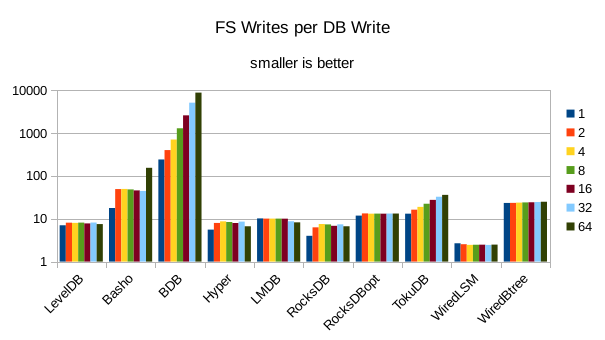
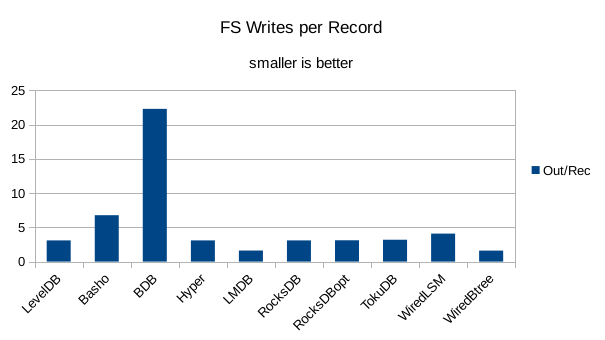
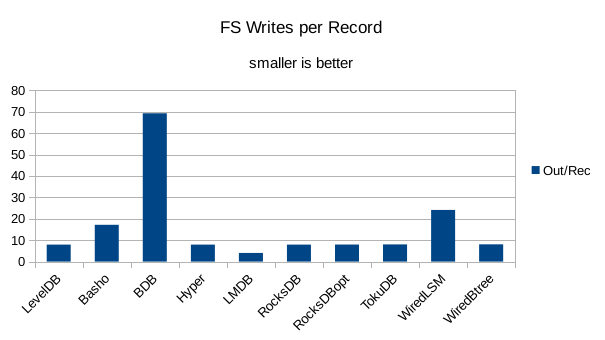
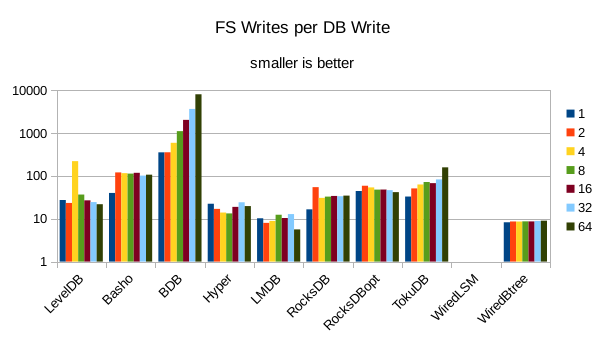
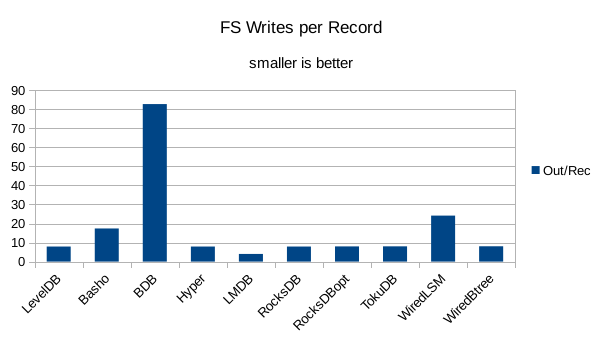
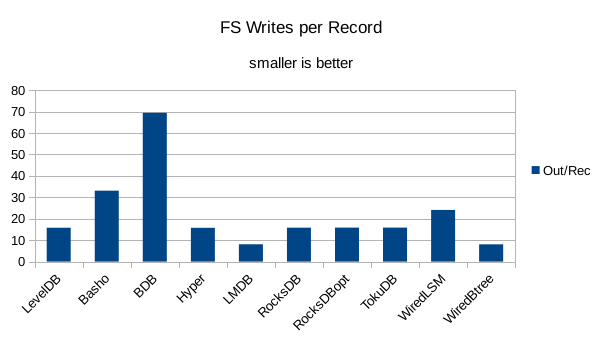
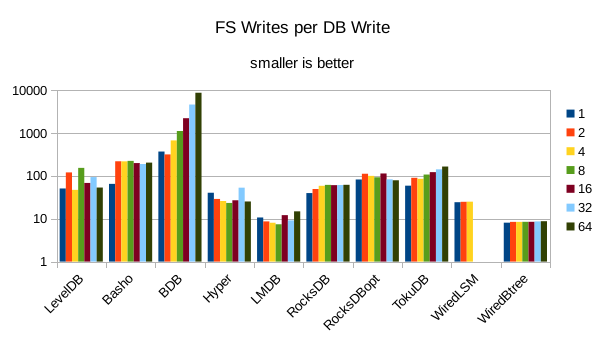
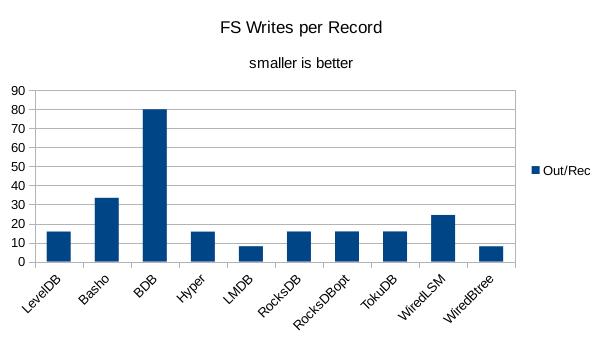
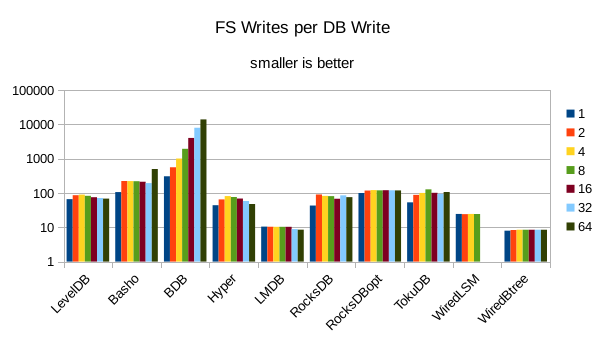
This chart shows the number of filesystem output operations (as recorded by the time command)
divided by the number of DB records. It gives a rough picture of how much write amplification
occurs for a batched sequential write task. It also corresponds quite closely with the
amount of wall clock time required to complete the load. For most of the engines the number
of writes per record is much less than 1 since they're writing batches of 1000 records
per DB write.
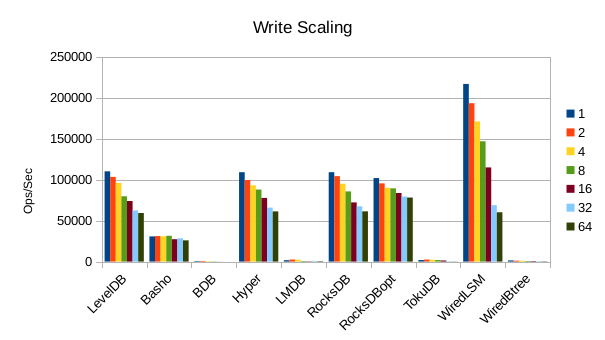
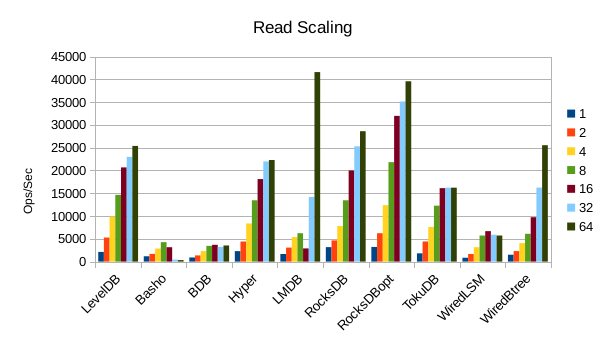
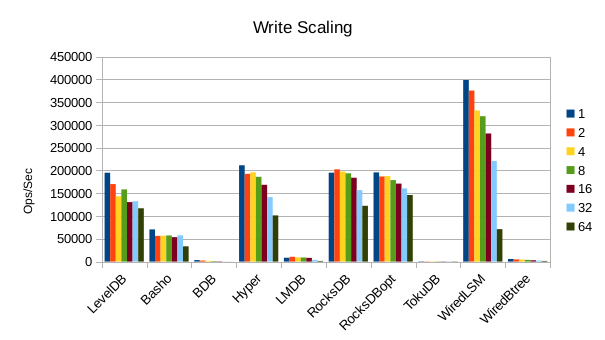
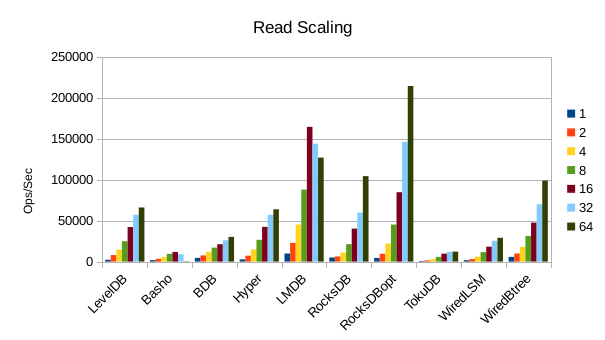
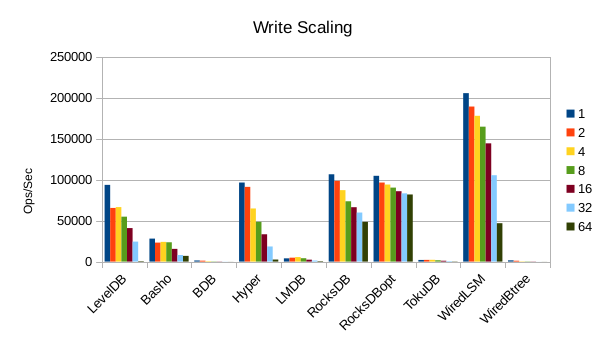
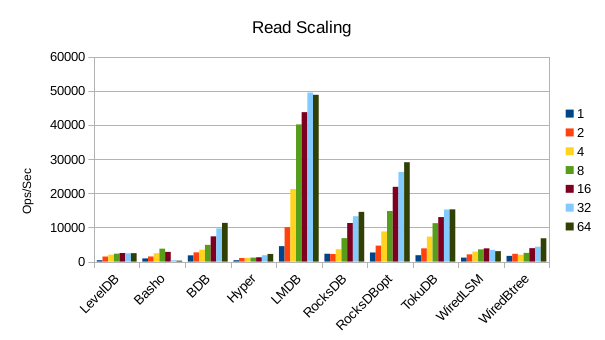
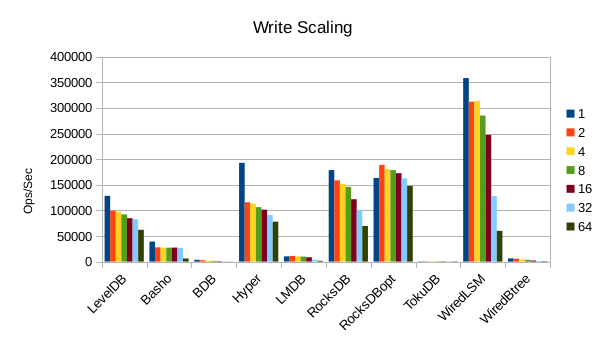
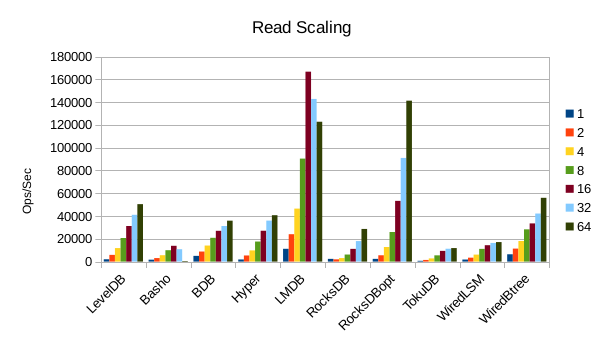
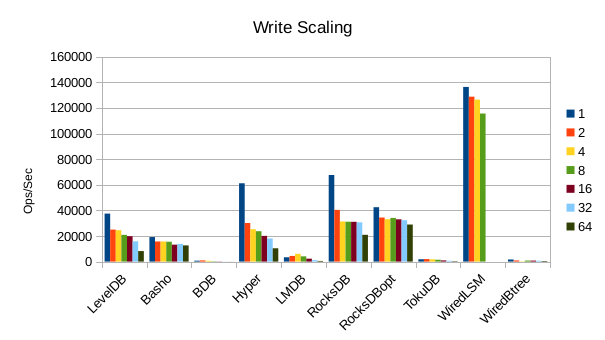
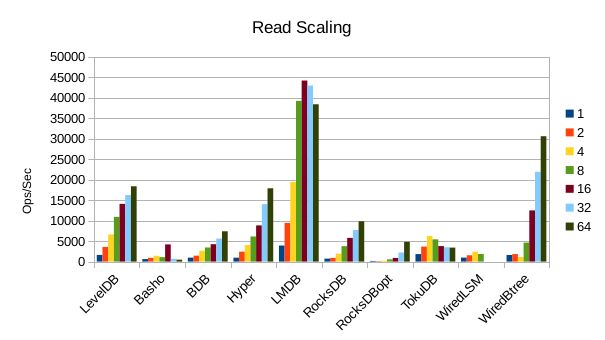
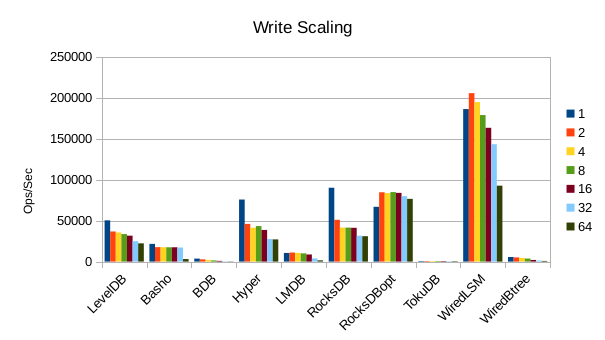
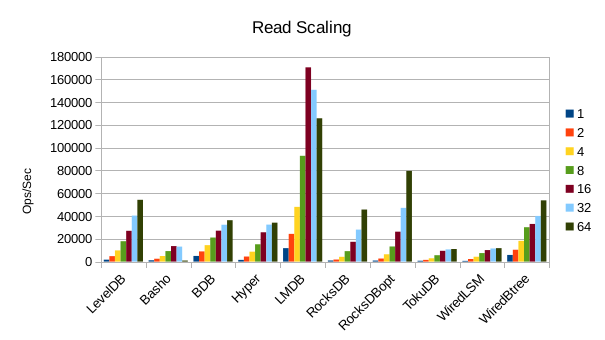
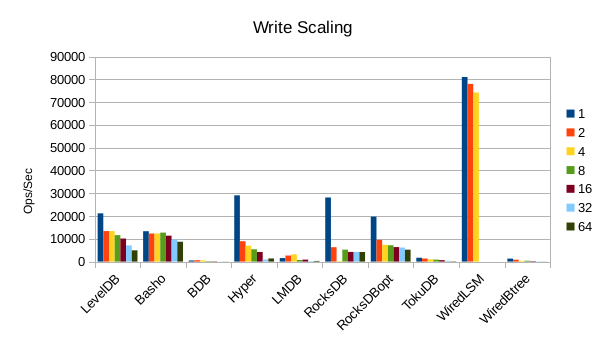
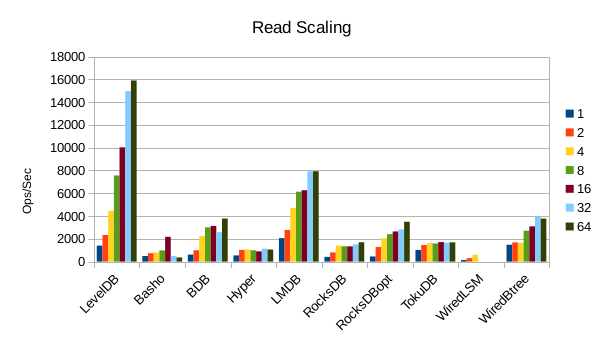
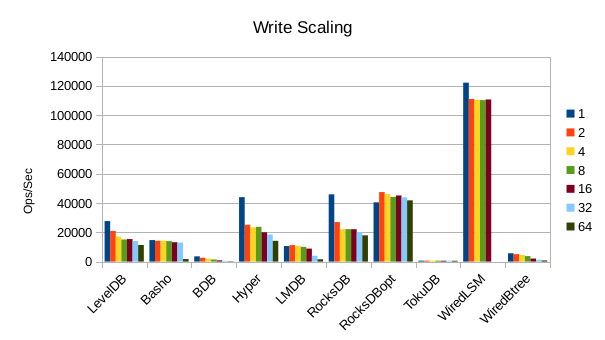
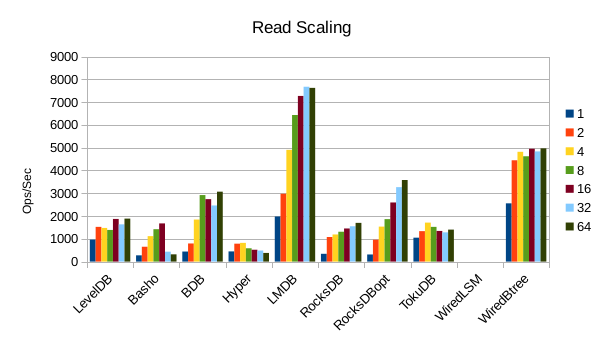
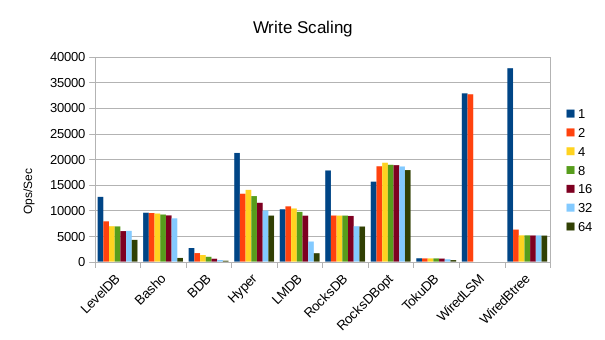
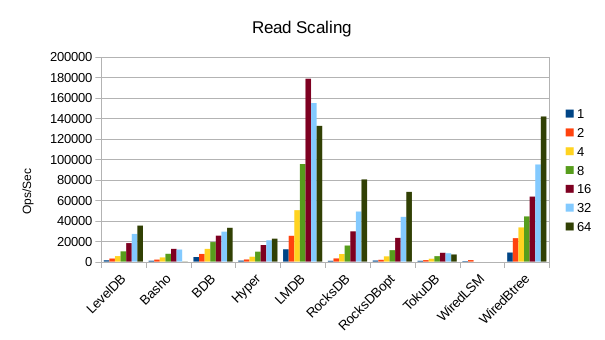
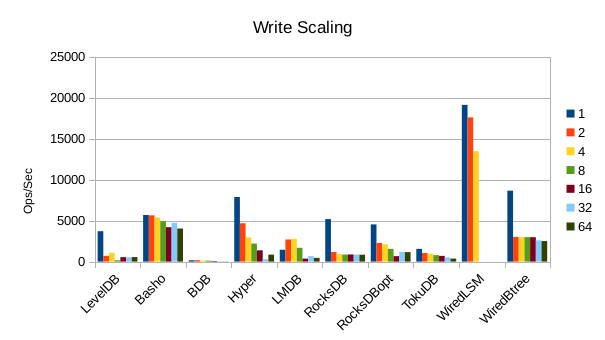
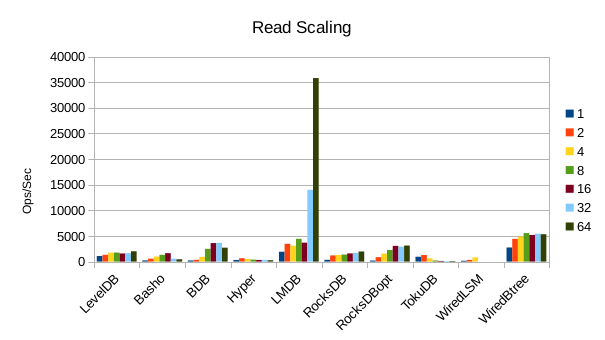
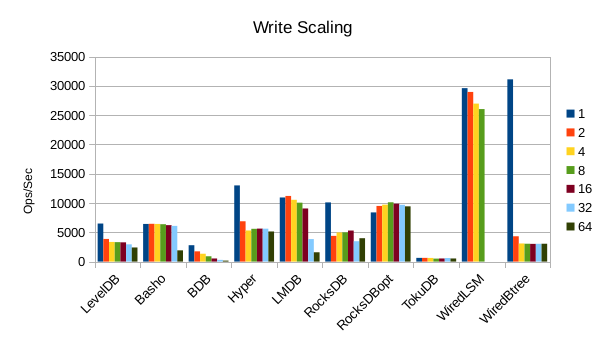
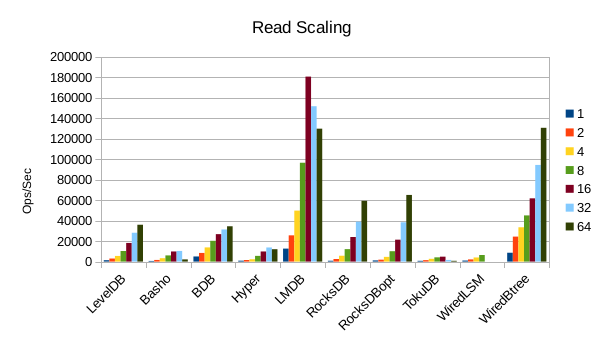
These charts show how write and read throughput scaled with increasing numbers of
readers. At this size all of the LSM-based engines have fast write throughput,
orders of magnitude faster than the Tree-based engines. Read performance is more
of a mixed bag. Also, the write scaling results for Basho LevelDB must be taken
with a large grain of salt. In every test with more than 1 reader thread, it spent
an extra 40-50 minutes compacting its DB before actually processing the test workload.
This extra time isn't reflected in any of these graphs but is shown in the spreadsheets
used to tabulate the results. All in all Basho LevelDB was one of the slowest DB engines
and we will likely drop it from future tests since it consumes so much time to run.
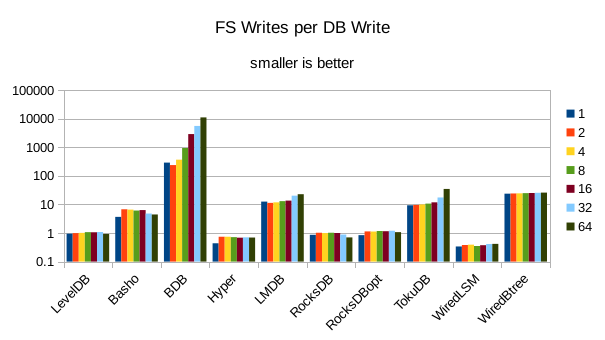
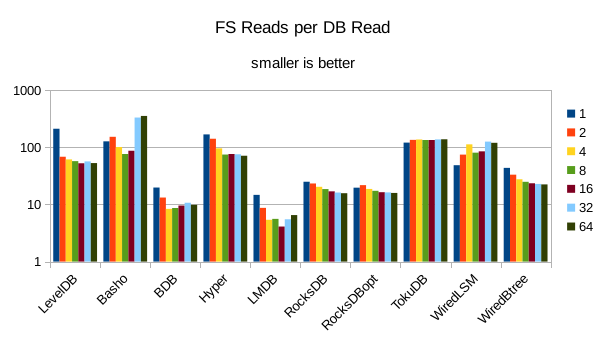
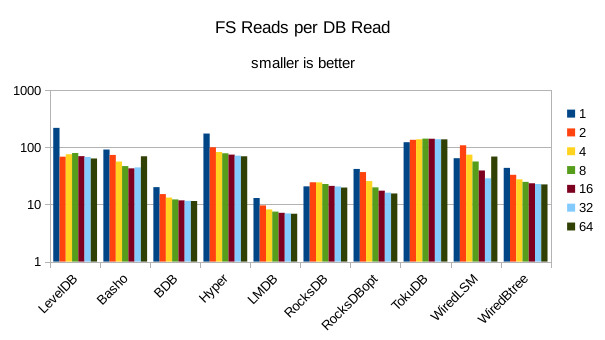
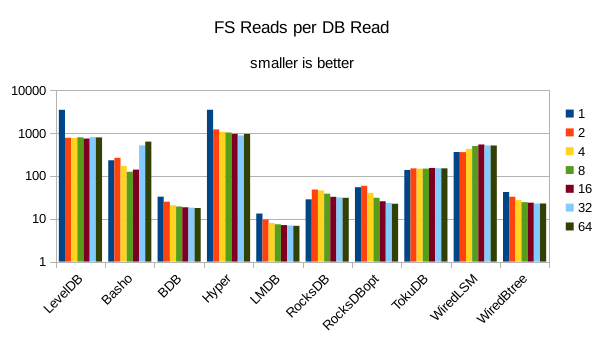
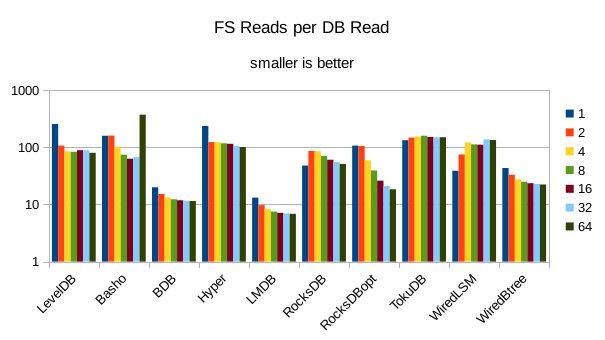
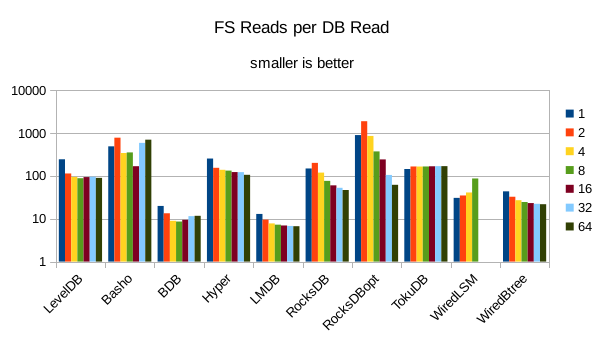
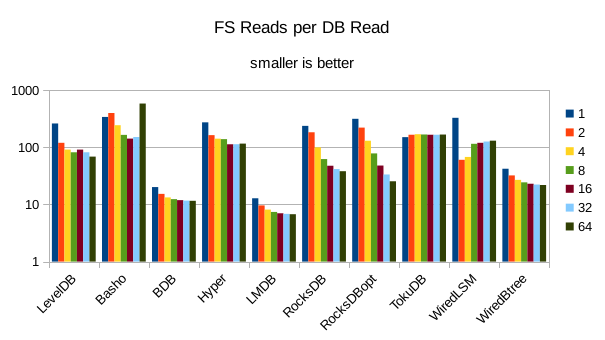
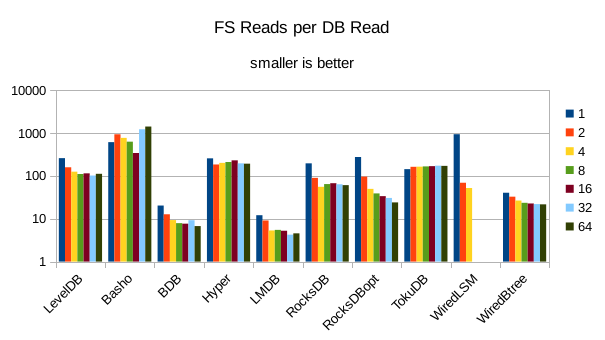
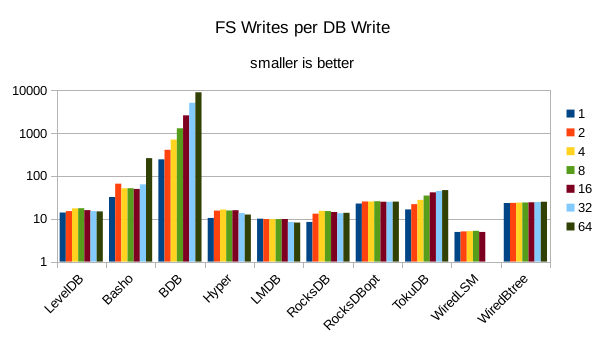
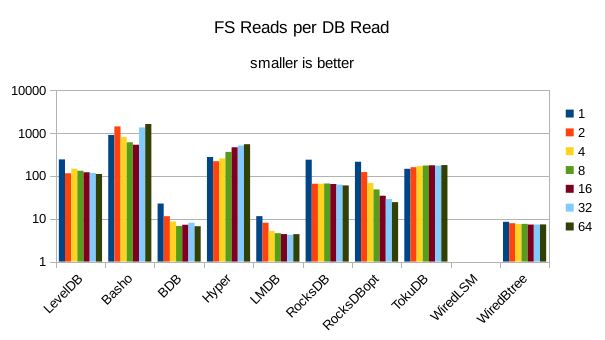
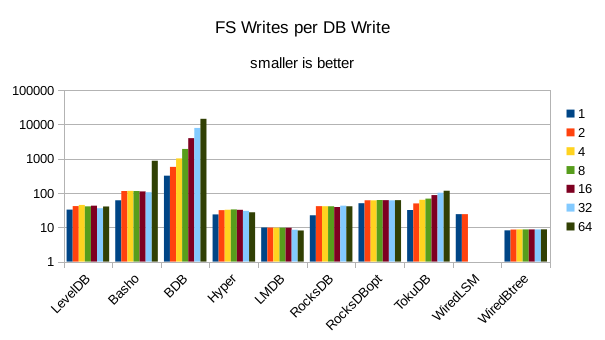
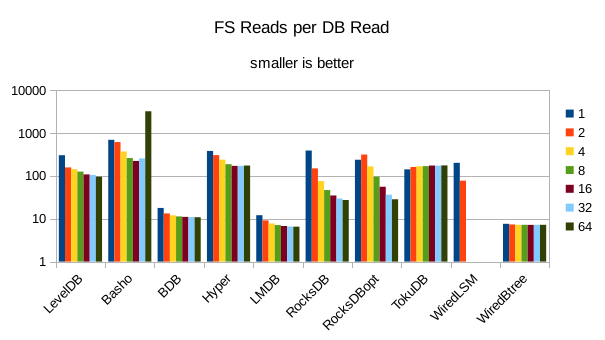
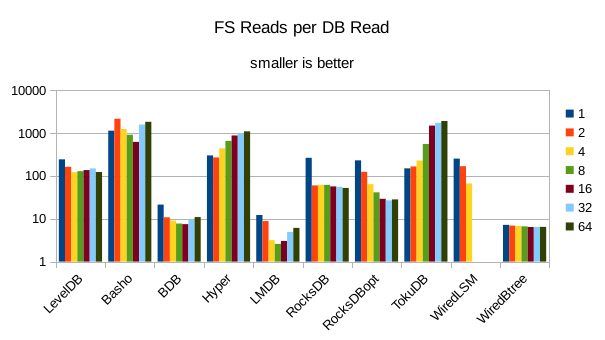
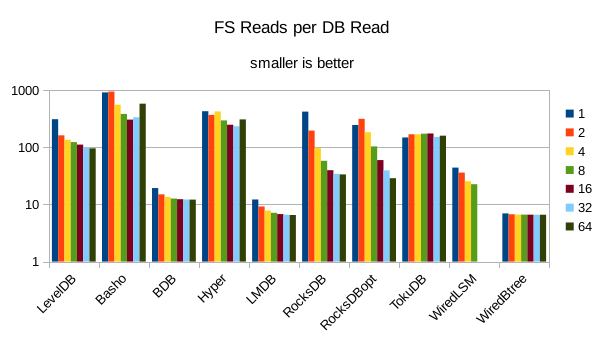
These charts show I/O efficiency in terms of the number of filesystem operations
divided by the total number of DB operations in each run. The charts are on a logarithmic
scale to fit everything in a compact space. The write efficiency
again corresponds closely with the write throughput - the engines with higher
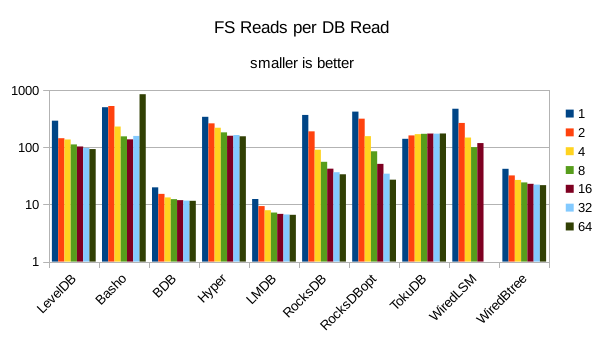
efficiency here had the highest write throughput. A similar pattern generally
exists for the readers, with notable exceptions of BDB and TokuDB - BDB shows
a small number of FS reads but still turns in poor read throughput because of its
high locking overhead. TokuDB shows a high number of FS reads but still manages
to avoid being the slowest. We would expect the number of FS ops per DB
op to be constant and independent of the number of reader threads; the fact
that the number of reads tends to decline as the number of threads increase indicates that as
the number of readers increase, there is a greater chance that two threads will
attempt to access the same record or neighboring records. In that case the FS
can satisfy both accesses with a single read operation. The fact that the number
of FS writes increases reflects the memory pressure from the greater number of
readers evicting written pages from memory earlier than would otherwise occur.
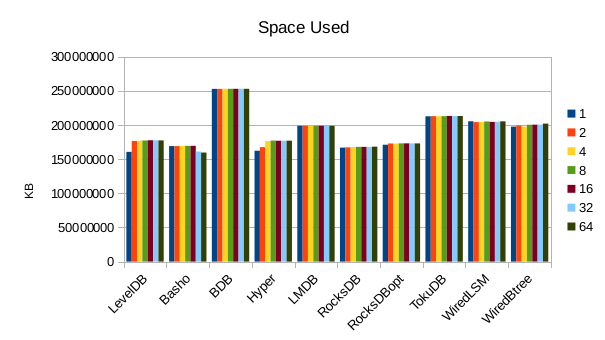
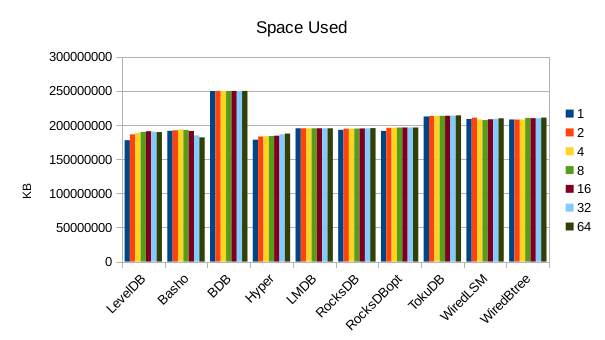
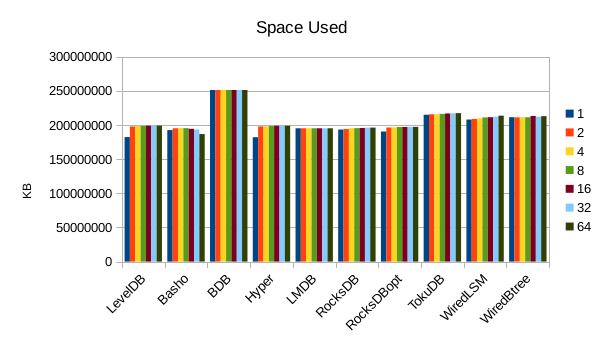
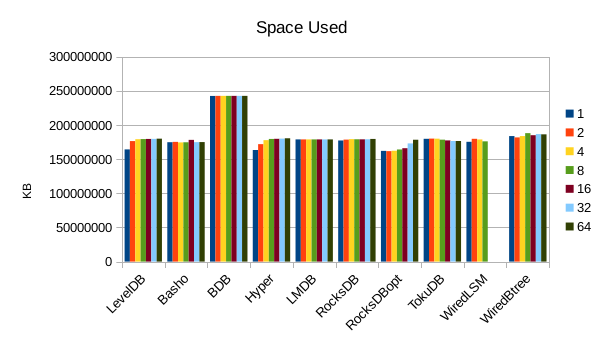
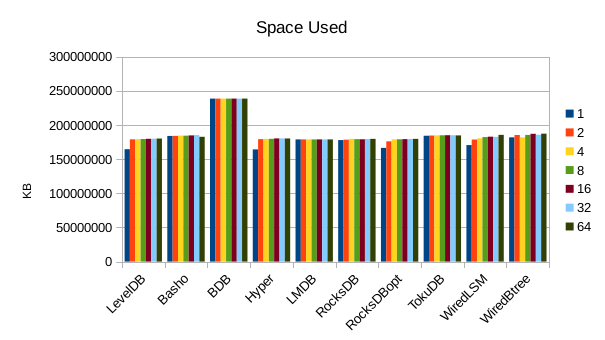
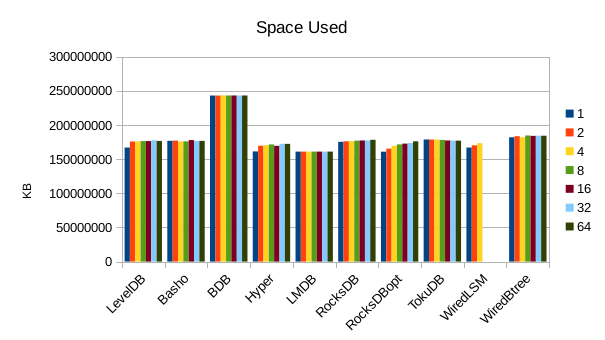
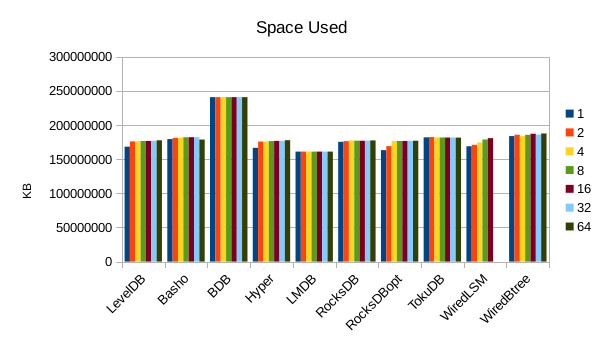
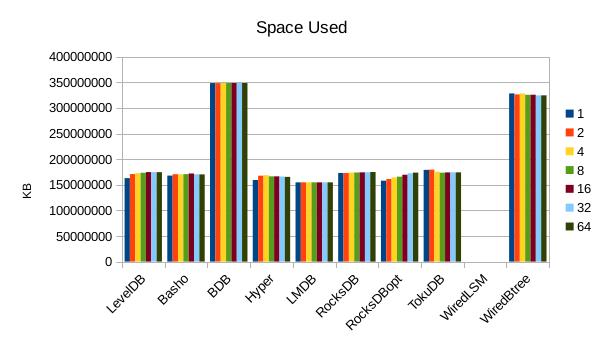
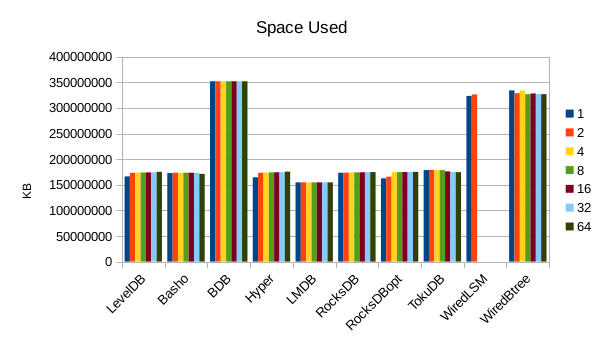
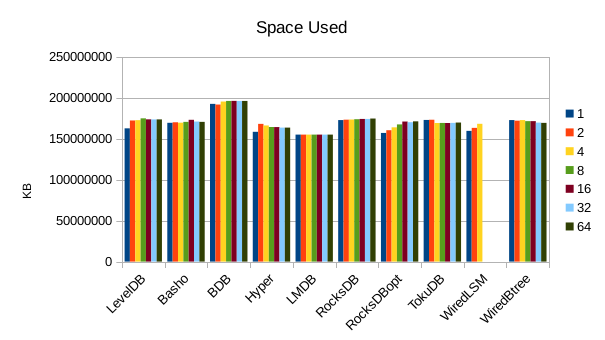
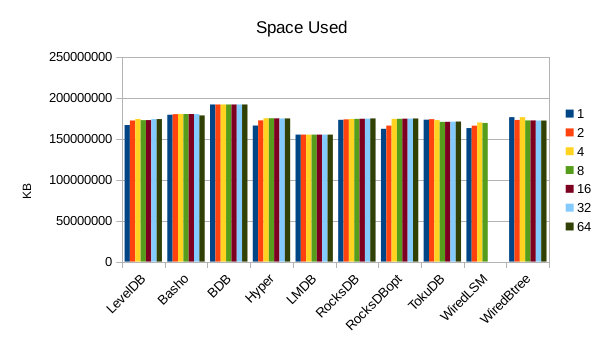
This chart shows the size of the DB at the end of each run. We expect the DB size
to remain relatively constant since writers are not adding or deleting records.
The size for Basho LevelDB drops slightly as a result of its compactor doing
some cleanup.
2. 24 byte values, Physical Server
The shape of the loading results is much the same as for the VM, but faster overall.
Optimized RocksDB posts a win on the read throughput here. It appears to be
well optimized for small data values.
The I/O efficiency trends have no real surprises here.

Also nothing particularly noteworthy about disk usage.
3. 96 byte values, VM
We use 1.6 billion records with 96 byte values.


4. 96 byte values, Physical Server

5. 384 byte values, VM
We use 400 million records with 384 byte values.


WiredTiger Btree has a distinct speed advantage in this loading process,
most likely because it simply has a lower per-record space overhead.
WiredTiger LSM filled up the disk and aborted during this sequence of runs.
Apparently the reader threads were preventing its compactor from running.
As a result of the WiredTiger LSM's compactor failing to run, we see
grossly inflated efficiencies in its Writes. Also, at this scale it
appears that LMDB is performing a number of writes on par with the
LSM engines, but it's still getting nowhere near the write throughput of
the LSMs. Even on flash arrays, the nature of the writes makes a
difference, and LMDB's random writes cannot be stored as quickly
as the more linearized LSM writes.
This chart doesn't show it, but WiredTiger LSM hit 400GB during the
16 reader test when it aborted.
6. 384 byte values, Physical Server


At this stage we're starting to see viable write speeds in LMDB.
7. 768 byte values, VM
We use 200 million records with 768 byte values.

At this record size, the 8 byte per-record overhead in LMDB is
pretty much on par with all the other DB engines.
Again, the WiredTiger LSM filled up the 400GB filesystem and aborted
during this sequence of runs. The LMDB results here are suspect; the VM
was experiencing some system freezes during these runs. Upgrading
to a 3.17 kernel eliminated the freezes but we have no test results
from the 3.17 kernel here.

8. 768 byte values, Physical Server

WiredTiger LSM filled the disk and aborted again during this run.
9. 2000 byte values, VM
We use 76.8 million records with 2000 byte values.

At this point LMDB is the most space-efficient.

WiredTiger LSM filled the disk on the first run of
this sequence. Many of the engines show very high write
rates while there is only 1 competing reader.
10. 2000 byte values, Physical Server
WiredTiger LSM again filled the disk and aborted during
this sequence of runs. The write amplification of the LSMs
is beginning to take its toll as well, as LMDB's write
scaling catches up to them.
11. 4000 byte values, VM
We use 38.4 million records with 4000 byte values.


WiredTiger LSM aborted again during this sequence of runs.
12. 4000 byte values, Physical Server

WiredTiger LSM aborted again during this sequence of runs. Although on the
runs it manages to complete it turns in some of the highest write rates,
we have to discount it because it obviously cannot sustain these rates; it's
achieving them by neglecting to compact its data files.
RDBMSs, X.500-style directories, and document-oriented
data stores typically store multiple fields in a single record and thus generally
have larger record sizes. For this type of use case B+tree engines will still provide
superior space efficiency as well as I/O efficiency.
OpenOffice spreadsheets. Very large, complex, and slow.
15378957 Nov 24 12:48 output.tgz Raw test output
The software versions we used:
Conclusion
LSMs are known for being highly write-optimized, but their
high write rates only hold up for fairly small data items. Their write speeds
are also highly erratic, having to periodically throttle back to perform compactions on
an ongoing basis.Files
The files used to perform these tests are all available for download.
2780330 Nov 24 12:27 2014x24hw.ods 24 byte values, physical server
2536848 Nov 24 12:27 2014x24vm.ods 24 byte values, VM
3153241 Nov 24 12:28 2014x96hw.ods 96 byte values, physical
2760592 Nov 24 12:28 2014x96vm.ods 96 byte values, VM
1669483 Nov 24 12:27 2014x384hw.ods 384 byte values, physical
1365428 Nov 24 12:27 2014x384vm.ods 384 byte values, VM
1284405 Nov 24 12:27 2014x768hw.ods 768 byte values, physical
0999897 Nov 24 12:27 2014x768vm.ods 768 byte values, VM
1299117 Nov 24 12:27 2014x2000hw.ods 2000 byte values, physical
1068459 Nov 24 12:27 2014x2000vm.ods 2000 byte values, VM
1229762 Nov 24 12:27 2014x4000hw.ods 4000 byte values, physical
0753862 Nov 24 12:27 2014x4000vm.ods 4000 byte values, VM
The command scripts: 24 byte, 96 byte,
384 byte, 768 byte,
2000 byte, 4000 byte.
The source code for the benchmark drivers
is all on GitHub.
Source code for crunching the output into CSV files is here.
We invite you to run these tests yourself and report your results back to us.
Software revisions used:

violino:/home/software/leveldb> g++ --version
g++ (Ubuntu 4.8.2-19ubuntu1) 4.8.2
Copyright (C) 2013 Free Software Foundation, Inc.
This is free software; see the source for copying conditions.  There is NO
warranty; not even for MERCHANTABILITY or FITNESS FOR A PARTICULAR PURPOSE.

violino:/home/software/leveldb> git log -1 --pretty=format:"%H %ci" master
e353fbc7ea81f12a5694991b708f8f45343594b1 2014-05-01 13:44:03 -0700

violino:/home/software/basho_leveldb> git log -1 --pretty=format:"%H %ci" develop
d1a95db0418d4e17223504849b9823bba160dfaa 2014-08-21 15:41:50 -0400

violino:/home/software/db-5.3.21> ls -l README
-rw-r--r-- 1 hyc hyc 234 May 11  2012 README

violino:/home/software/HyperLevelDB> git log -1 --pretty=format:"%H %ci" master
02ad33ccecc762fc611cc47b26a51bf8e023b92e 2014-08-20 16:44:03 -0400

violino:~/OD/mdb> git log -1 --pretty=format:"%H %ci"
a054a194e8a0aadfac138fa441c8f67f5d7caa35 2014-08-24 21:18:03 +0100

violino:/home/software/rocksdb> git log -1 --pretty=format:"%H %ci"
7e9f28cb232248b58f22545733169137a907a97f 2014-08-29 21:21:49 -0700

violino:/home/software/ft-index> git log -1 --pretty=format:"%H %ci" master
f17aaee73d14948962cc5dea7713d95800399e65 2014-08-30 06:35:59 -0400

violino:/home/software/wiredtiger> git log -1 --pretty=format:"%H %ci"
1831ce607baf61939ddede382ee27e193fa1bbef 2014-08-14 12:31:38 +1000
All of the engines were built with compression disabled; compression was not used
in the RocksDB test either. Some of these engines recommend/require use of a non-standard
malloc library like Google tcmalloc or jemalloc. To ensure as uniform a test as possible, all
of the engines in this test were built to use the standard libc malloc.